
How to export a Plotly chart as HTML

In this post, I will show how to create charts in Python using the Plotly library, by exporting them as plain HTML files.
See live demo here.
Plotly (among other things) offers a great Javascript open source library to build beautiful charts in your Web apps. Charts have many cool features and they are interactive (e.g., can be zoomed, panned, etc…). The same library can also be used from Python to embed charts, for example, in Jupyter notebooks.
In your Python workflow, suppose you have analyzed your data and built your awesome charts inside Jupyter. Now you want to publish your work and share it. You have of course many options. One of the easiest ways is nonetheless exporting everything as static HTML files (and maybe deploying them for free on Netlify).
Now let’s see how to do this. All the code for this blog post is published on GitHub.
First of all you need to install the Plotly package:
pip install plotlyMany expert Python users often prefer to install new packages in virtual environments. I am not covering this theme here, but I’d like to suggest to use pipenv to handle virtual environments and all related stuff.
For this example, I use the Iris data set, already included in Plotly:
df = px.data.iris()The returned object is a Pandas dataframe. The data set contains four features, width and length of the petal, and width and length of the sepal. For the purpose of this example, I build two separate scatter plots, one for the sepal and one for the petal.
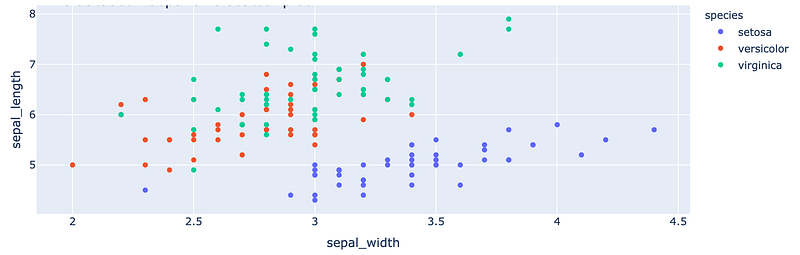

The plots can be easily created in the following way:
import plotly.express as pxplot = px.scatter(data_frame=df, x=x_name, y=y_name, color='species', title=title)Now you export the plot to HTML as a standalone iframe.
plot.write_html(outpath,
                full_html=False,
                include_plotlyjs='cdn')
The key takeaways here are:
- the
full_htmlparameter set to false tells Plotly that we want a file containing only adiv include_plotlyjsset tocdnmeans that you don’t want to include the full Plotly Javascript into your HTML, but just link to the online version.
The last step is to create a main HTML file that includes the two iframes just created:
<div class="container-fluid" style="margin-top:40px"> <iframe src="sepal_plot.html" width="100%" height="300"></iframe> <iframe src="petal_plot.html" width="100%" height="300"></iframe> </div>Note that, to make the example a little bit more interesting, I have added some Bootstrap code.
That’s it. You can now share your HTML files or publish them online.


