
How to Evaluate Clustering Performance without Ground Truth Labels
An illustrative guide to choosing an appropriate validity metric based on cluster conformation
Introduction
There are plenty of methods available from the supervised learning playbook to evaluate clustering performance for situations where the ground truth labels are known. However, performance evaluation is not as straightforward when the ground truth is not available. In this case, we need to rely on validity metrics that give us an indication of how well clusters are defined. These validity metrics rely heavily on the underlying conformation of the clusters in the data.
For data composed of convex, globular clusters, a variety of validity metrics have been proposed, the most popular being the Silhouette Coefficient. Others include the Calinski-Harabasz Index, the Davies-Bouldin Index, and the Dunn Index. However, not all data are composed of globular clusters. Some clusters can take on arbitrary shapes that are separated by density. In such cases, we can leverage the Density-Based Clustering Validation metric, or DBCV.
Note: The data used in the illustrations below was generated using scikit-learn’s make_blobs, make_moons, and make_circles functions.
Globular Clusters
For clusters with predominantly globular shapes, the Silhouette Coefficient [1] is most commonly used to evaluate performance. It is a measure based on how similar a data point is to its own cluster compared to other clusters. Its value ranges from -1, indicating incorrect clustering, to +1, indicating highly dense clustering and good separation. Values close to 0 are indicative of overlapping clusters. An algorithm that is very well suited for identifying globular clusters is K-Means.
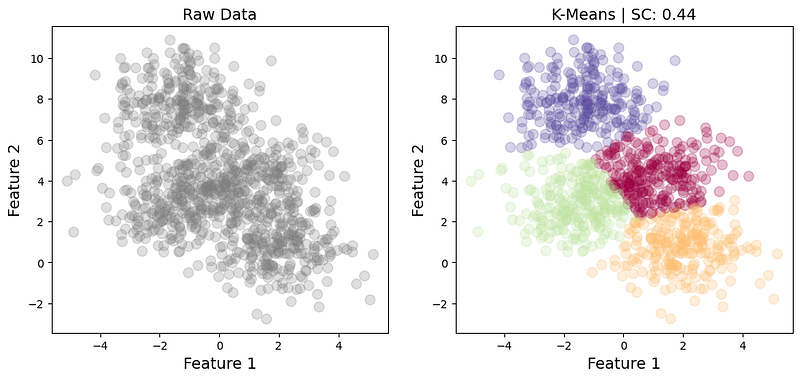
Below is an example of data comprised of 4 globular clusters (Fig. 1). The standard deviation of the clusters here is 1.2, which results in some inter-cluster overlaps. However, K-Means still achieves a decent separation with a Silhouette Coefficient of 0.44.
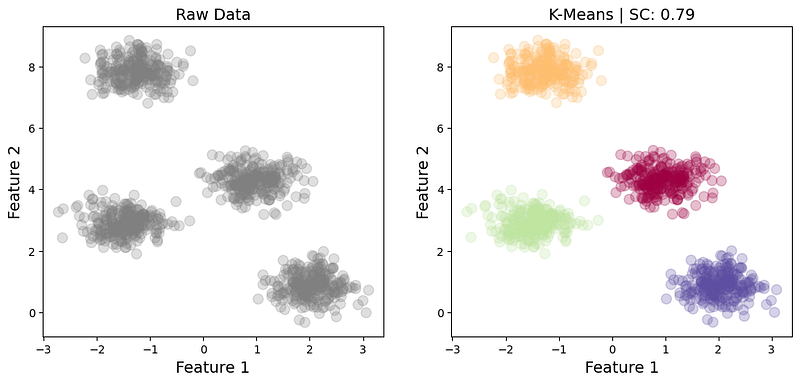
If we have extremely well-defined clusters (Fig. 2), we would expect a higher validity score. This is exactly what we obtain in the example below, which achieves a Silhouette Coefficient of 0.79. The standard deviation of the clusters in this example is 0.4, yielding a much better separability.
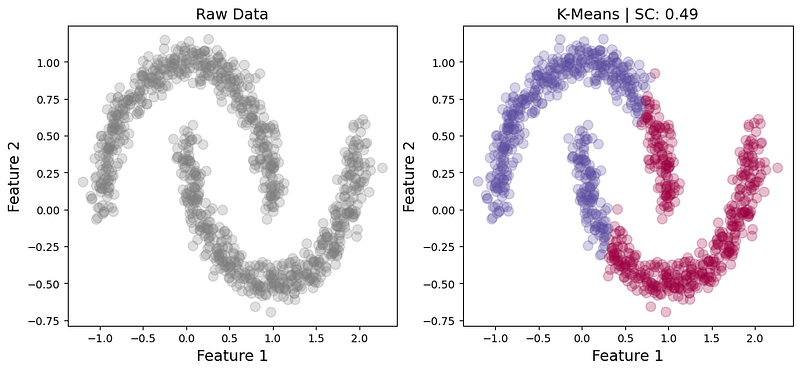
However, if the clusters are not characterized by globular shapes, the Silhouette Coefficient may not be an appropriate validity metric. Moreover, K-Means may not be the appropriate clustering algorithm, as it typically prefers globular shapes. In the example below, K-Means clearly misclassifies parts of the crescents, even though the Silhouette Coefficient still yields a misleadingly decent value of 0.49.
Arbitrarily Shaped Clusters
For clusters with arbitrary shapes and sizes, the Density-Based Clustering Validation (DBCV) [2] is the preferred evaluation metric. It assesses cluster quality based on the within- and between-cluster density. Good results are achieved by having a high density within clusters and a low density between clusters. Similar to the Silhouette Coefficient, DBCV ranges from -1 to +1, with higher scores indicating better cluster quality.
There are various, commonly used clustering algorithms that are capable of identifying arbitrarily shaped clusters, such as DBSCAN, HDBSCAN, or OPTICS. For the illustrations below, I will use HDBSCAN (hierarchical density-based spatial clustering for applications with noise).
Let’s see how HDBSCAN performs on the two crescents:
As the two crescents appear to be separable by density, it is no surprise that HDBSCAN separates them quite well with a corresponding DBCV of 0.54. By contrast, the DBCV based on the K-Means labels (Fig. 3) is -0.76, indicating incorrect clustering due to misclassified data points, as expected.
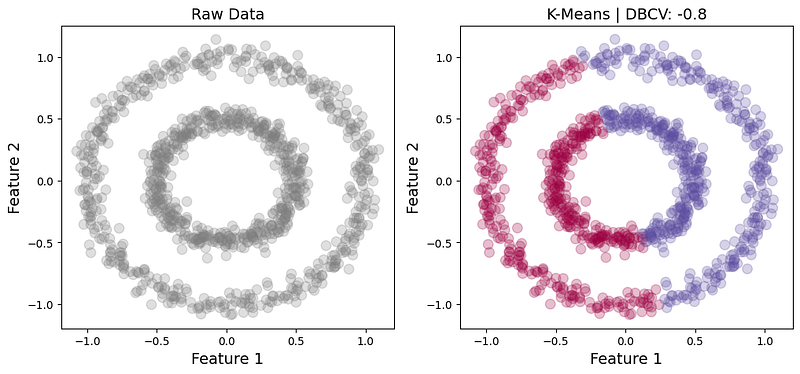
Let’s look at another example of arbitrarily shaped clusters:
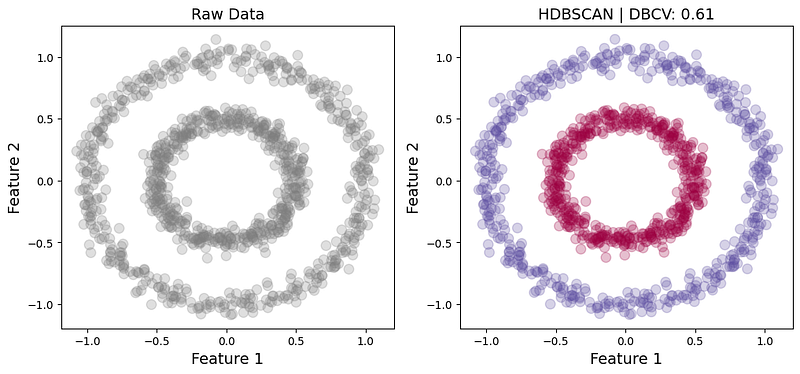
Again, these two circles seem to be separable by density and, consequently, HDBSCAN achieves descent results with a DBCV of 0.61. K-Means, by contrast, struggles to separate them and, as a result, the associated DBCV is -0.8 (Fig. 6).
Conclusion
If the ground truth is not available, one has to rely on model-based performance evaluation metrics. While the Silhouette Coefficient is a reliable metric for data comprised of convex, globular clusters, it often fails on arbitrarily shaped clusters and can yield deceivingly high scores despite obvious misclassifications. In such cases, the DBCV is the preferred metric to choose as it demonstrably handles arbitrary shapes much better.
References
[1] Peter J. Rousseeuw (1987). “Silhouettes: a Graphical Aid to the Interpretation and Validation of Cluster Analysis.” Computational and Applied Mathematics 20: 53–65.
[2] Moulavi, Davoud, et al. (2014). “Density-based clustering validation.” Proceedings of the 2014 SIAM International Conference on Data Mining. Society for Industrial and Applied Mathematics.


