
How to Scrape Data From Reddit Using Python — With Code
This article is a comprehensive overview of the data collection process from Reddit for free.

Introduction
In today’s fast-growing data-driven environment, many institutions often face a lot of difficulties when collecting diverse and relevant data.
The challenges they face include by are not limited to high costs, and a time-consuming process, making the overall task complex and resource-intensive.
At the same time, millions of data of different types (text, image, audio, video) are being created on social media platforms every day, making those platforms stand out as invaluable resources to overcome these challenges.
For instance, Twitter has 330 Million monthly active users , 134 Daily active users , 460k daily new accounts and 140 million daily Tweets
Furthermore,Reddit has 330 million monthly active users , 14 billion views per month , and 25 million daily votes.
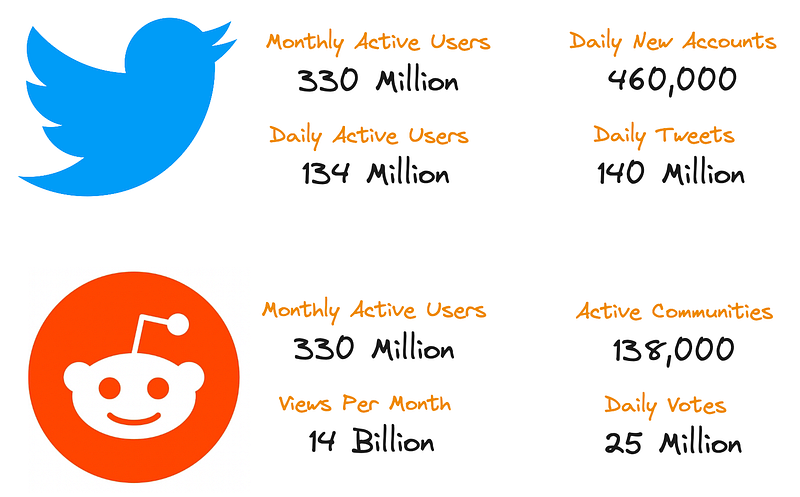
These statistics are quite compelling and clear the doubt that these platforms are data-generating machines!
Failing to utilize these golden resources is like being thirsty in the middle of the sea.
In this article, you will learn how to efficiently and easily extract data from these social media platforms with a specific focus on Reddit, using the Python programming language.
Data Collection Process
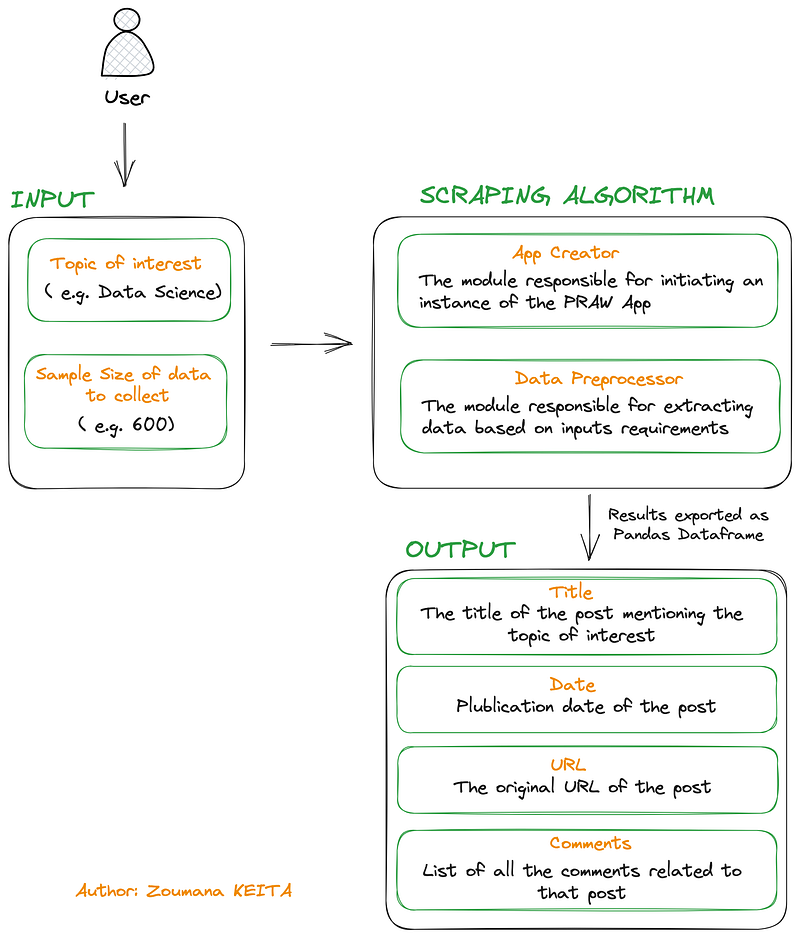
Below is the overall workflow for collecting data from Reddit.
- The user will specify the topic he/she would like to collect data about, let’s say
Data Science, and will also specify the total number of posts mentioningData Sciencewhich can be600 - Then the
App Creatorthe module will create an instance ofPython Reddit API WrapperorPRAWfor short which triggers the access to Reddit for data collection. - Furthermore, the
Data Preprocessorcollects the posts with respect to the inputs’ requirements. - Finally, the collected data is exported as a pandas data frame along with the
Title, theDate, theURLand theCommentsof each post.
Pre-requisites
There are two main requirements to successfully complete this tutorial: (1) create a Reddit App, and (2) configure the App instance.
#1 Create Reddit App
The first step is to access the Reddit login page, which will allow the creation of the API credentials in five main steps as highlighted below:
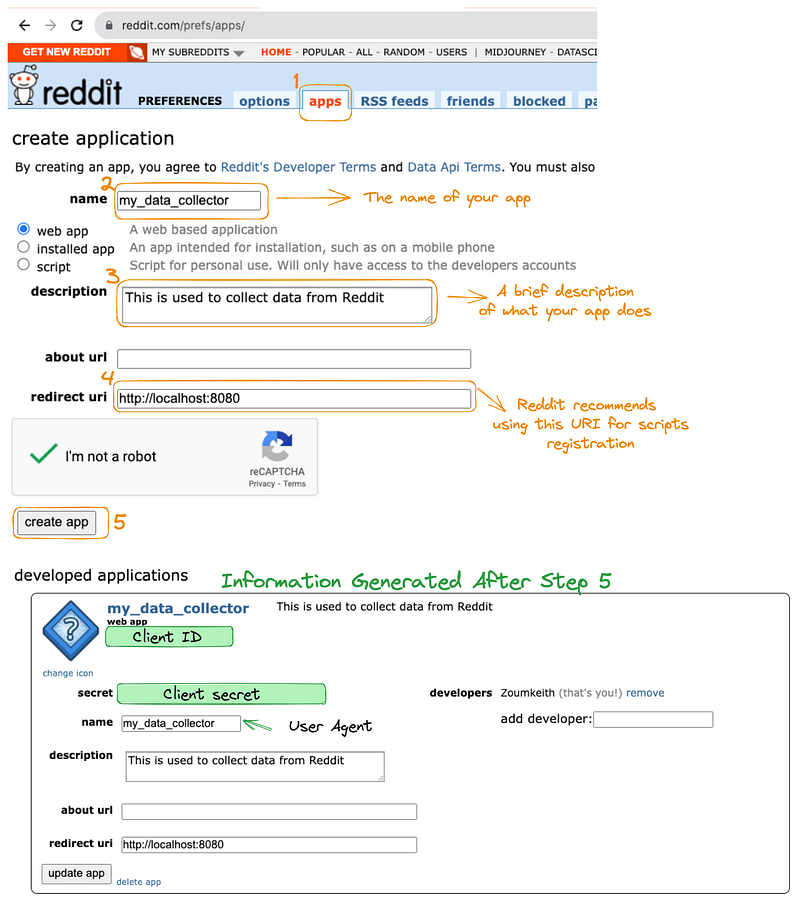
The credentials required to configure the Reddit App is generated after Step 5 , this is personal information and make sure to jealously keep it!
#2 Configure the App Instance
Next, an instance of the app can be created by filling the client_id , client_secret and user_agent sections in the Reddit class below after installing and importing the praw library.
$ pip install praw# Import the PRAW API
from praw import Reddit
# Configure an instance of your app
my_Reddit_App = Reddit(client_id = 'my_client_ID',
client_secret = 'my_secret',
user_agent = 'my_user_agent')Data Collection
The data collection is performed on Subreddit, which is the Reddit forum dedicated to a specific topic such as Artificial Intelligence , Data Science , Deep Learning , and more.
For simplicity’s sake, we will stick to only one topic, and an example is given below for collecting Data Science subreddit, and we set the limit to the first 100 results with the .hot() function.
data_science_subreddit = my_Reddit_App.subreddit('DataScience').hot(limit=100)
print(data_science_subreddit)Output:
<praw.models.listing.generator.ListingGenerator object at 0x7f4f4a68a410>
During the data collection, not all the 100 posts are immediately downloaded, instead, a ListingGenerator instance is returned, which can then be used to access each post with the next() function.
next_reddit = next(data_science_subreddit)
print(type(next_reddit))Output:
<class 'praw.models.reddit.submission.Submission'>
We can notice that the previous Reddit’s type aSubmission , which corresponds to a post on Reddit, and each Submission typically includes properties such as the Title , URL , creation date .
To get an exhaustive list of all the attributes, we can use the dir() function combined with the helper function print_all_attributes() as illustrated below:
all_attributes = dir(next_reddit)
# Helper function to print all the attributes
def print_attributes_in_table(data, columns):
for i in range(0, len(data), columns):
print(',\t'.join(data[i:i+columns]))
# Run the function
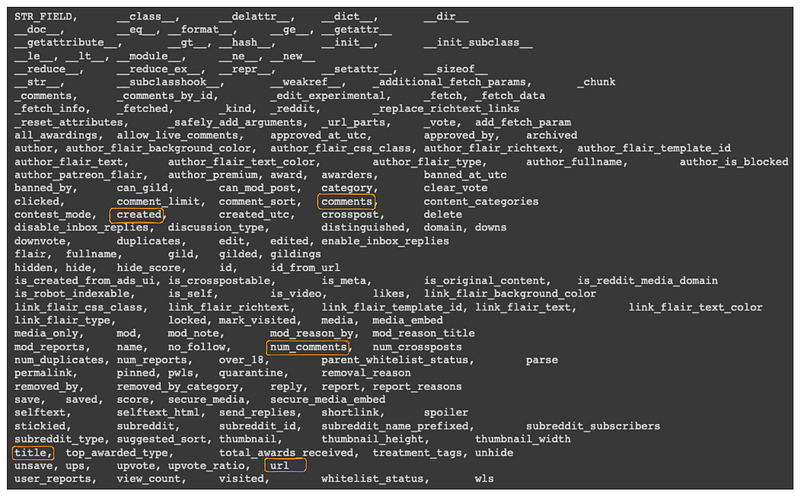
print_attributes_in_table(all_attributes, 5)The result below is showing all the attributes in a table of five columns, and some of the attributes are highlighted in an orange rectangle:
created: the date of creation of the postcomments: the list of all the comments related to the postnum_comments: number of comments this post hadtitle: the title of the posturl: the URL of the post
The commentsvariable is a praw.models.comment_forest.CommentForest type, we will need to iterate through each comment in the CommentForest to get the values. This is done with the extract_comment_from_forest function.
def extract_comments_from_forest(submission):
all_comments = []
# Start iterating through each comment in the forest and get the content
submission.comments.replace_more(limit=0) # Flatten the tree
comments = submission.comments.list() # all the comments
for comment in comments:
all_comments.append(comment.body)
return all_commentsNow, we can proceed with the creation of the logic to create the Pandas data frame containing all the posts, as implemented in the extract_top_N_post which returns the first N=100 posts by default.
import pandas as pd
import datetime as dt
def extract_top_N_posts(topic_of_interest, N = 100):
topic_of_interest = topic_of_interest.replace(' ', '')
final_list_of_dict = []
dict_result = {}
submissions = my_Reddit_App.subreddit(topic_of_interest).hot(limit=N)
for submission in submissions:
dict_result["title"] = submission.title
dict_result["creation_date"] = dt.datetime.fromtimestamp(submission.created)
dict_result["id"] = submission.id
dict_result["url"] = submission.url
dict_result["comments"] = extract_comments_from_forest(submission)
final_list_of_dict.append(dict_result)
dict_result = {}
# Create the dataframe
df = pd.DataFrame(final_list_of_dict)
return dfFrom the function:
- We start by defining the relevant variables
- Then in the
forloop we define all the attributes to be returned in the final dictionary. - Finally, we convert the resulting dictionary into a pandas data frame.
Let’s see the function in action 🚀 with the extraction of the Reddits about DataScience .
data_science_reddits_df = extract_top_N_posts('DataScience')By checking the size of the dataset, we can see that there are 100 rows and 5 columns. Also, the first five rows are displayed with the display function.
print(data_science_reddits_df.shape)
# => (100, 5) #--> 100 rows and 5 columns

display(data_science_reddits_df.head())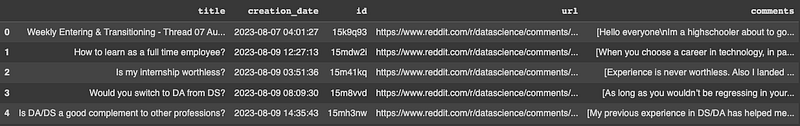
Wonderful, you did it! But before wrapping up, let’s have a quick data visualization!
Quick Data Visualization
The goal here is to analyze the comments and have a broad overview of which topics are being discussed about DataScience . The real-time nature of the results can make your result different from mine.
Some data cleaning is required prior to visualizing the comments, and the overall logic is implemented in theclean_text() function.
Data cleaning
The function data cleaning function leverages the following libraries:
NLTK: one of the most used packages for text preprocessingre: the regular expression package for data cleaning and extractionemoji: used to detect and convert emojis into their textual format
from nltk.corpus import stopwords
import nltk
nltk.download("stopwords")


import re
from emoji import demojize

STOPWORDS = set(stopwords.words('english'))
MIN_LEN = 2

def clean_text(text):

  # Remove all closing and opening brackets
  text = re.sub(r"[\([{})\]]", "", text)

  # Remove URLs
  text = re.sub(r"http\S+", "", text)

  # Remove numeric values
  text = re.sub(r"[0-9]", "", text)

  # Remove stopwords
  text = " ".join([word for word in text.split() if word not in STOPWORDS])

  # Remove words with length < threshold
  text = " ".join([word for word in text.split() if len(word) > MIN_LEN])

  # Convert emojis to textual format
  text = demojize(text)

  return text
The main text-cleaning processes performed in the function are: removing all closing, and opening brackets, URLs, numeric values, stopwords, all words less than two characters, and finally converting emojis to text.
Visualization function
The visualization function generates the word cloud of the comments and the main modules used are:
wordcloud: the library that provides theWordCloudclass for creating an instance of thewordcloudmatplotlib: used to generate the result in a graphical format
from wordcloud import WordCloud
import matplotlib.pyplot as plt

def show_wordcloud(comments):

  all_comments = ' '.join(comments)

  wordcloud = WordCloud(width=5000, height=4000,
                           background_color='black',
                           min_font_size=10).generate(all_comments)

  plt.figure(figsize=(12, 12), facecolor='k', edgecolor='k')
  plt.imshow(wordcloud)
  plt.axis("off")
  plt.tight_layout(pad=0)
  plt.show()
The function creates a wordcloud of the comments with a black background, a width of 5000, and a height of 4000. The final result is displayed in a window of 12x12 dimension.
Show the final result
By combining all the above functions we get the following code, which provides all the necessary comments for better understanding the overall process.
import itertools

# Get all the comments
list_all_comments = data_science_reddits_df['comments'].tolist()

# Remove all the empty lists (empty comments)
list_all_comments = [list_of_comments for list_of_comments in list_all_comments if list_of_comments != []]

# Convert all the comments as a single list
all_comments = list(itertools.chain.from_iterable(list_all_comments))

# Clean the comments
cleaned_comments = [clean_text(comment) for comment in all_comments]

# Show the wordcloud
show_wordcloud(cleaned_comments)
Output:
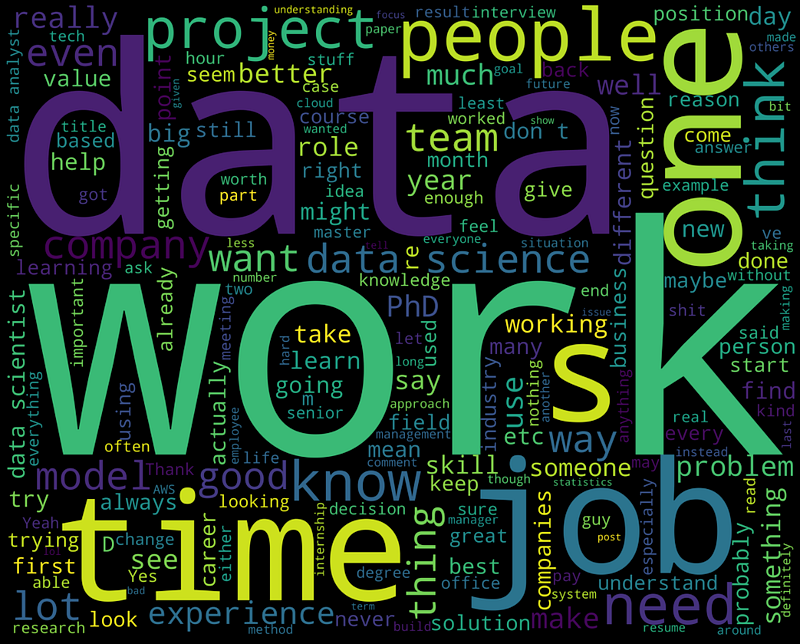
The bigger the word in the cloud, the most representative it is. We can see that data, work, data science, people model, etc are most represented.
Additional preprocessing such as stemming and n-grams can be performed for a more meaningful word cloud.
Conclusion
Congratulations!!!🎉
I hope this article helped you acquire the skills needed to achieve your goal. Check out my article explaining how to collect data from Twitter using the Tweepy library.
The source code of the article is available on my GitHub.
Also, If you enjoy reading my stories and wish to support my writing, consider becoming a Medium member. It’s $5 a month, giving you unlimited access to thousands of Python guides and Data science articles.
By signing up using my link, I will earn a small commission at no extra cost to you.
Feel free to follow me on Twitter, and YouTube, or say Hi on LinkedIn.
Before you leave, there are more great resources below you might be interested in reading!