avatarLiu Zuo Lin

Free AI web copilot to create summaries, insights and extended knowledge, download it at here

1715

Abstract

/p><figure id="7076"><img src="https://cdn-images-1.readmedium.com/v2/resize:fit:800/1*S0JaE6t0mO5REUfYKRgHbQ.png"><figcaption></figcaption></figure><p id="e729">Note that in <code>network.add_edge('A', 'B')</code>, A comes before B which means that the arrow points from A to B. If we reverse this, we get the opposite effect.</p><figure id="c9a5"><img src="https://cdn-images-1.readmedium.com/v2/resize:fit:800/1*MRrwtG4hrY26vxu33N6IcA.png"><figcaption></figcaption></figure><h1 id="3a59">4) Wobble it</h1><p id="547e">Click on one of the balls (or the line) using your mouse, and drag it around. Notice that it wobbles and follows your mouse pointer.</p><h1 id="366d">5) Let’s draw more balls and lines</h1><figure id="47b5"><img src="https://cdn-images-1.readmedium.com/v2/resize:fit:800/1*hoF8rGljll51wCzvr0NEGA.png"><figcaption></figcaption></figure><p id="42f6">Yay, more balls and lines. But to be honest, that was quite annoying to type. Is there a way to not have to use the same function repeatedly? Yep.</p><h1 id="7378">6) Using .add_nodes() and .add_edges()</h1><p id="1bcd">If you’ve got many many nodes and lines you wish to add, consider using <code>.add_nodes()</code> and <code>.add_edges()</code> like the below example. This way, you don’t have to type out <code>.add_node()</code> and <code>.add_edge()</code> so many times.</p><figure id="b589"><img src="https://cdn-images-1.readmedium.com/v2/resize:fit:800/1*-f2Jmi85Lfux4VME9hI0bw.png"><figcaption></figcaption></figure><h1 id="81dd">More Tips And Tricks</h1><ul><li>in <code>.add_node('A', label='A')</code>, the label must be a string (for some reason), so if you want to use a number, remember to <code>str(n)</code></li><li><code>direc

Options

ted=True</code> in the first line makes this a directed graph. To make it undirected, just set <code>directed</code> as False.</li><li>you can change the height and width of the graph</li><li>the graph is actually saved in a HTML file <code>test.html</code></li></ul><h1 id="65b3">Conclusion</h1><p id="290c">Hope you had fun drawing wobbly graphs.</p><h1 id="fbc6">Some Final words</h1><p id="f812"><i>If this story provided value and you wish to show a little support, you could:</i></p><ol><li><i>Clap 50 times for this story (this really, really helps me out)</i></li><li><i>Sign up for a Medium membership using <a href="https://zlliu.medium.com/membership">my link</a> ($5/month to read unlimited Medium stories)</i></li></ol><p id="f58d"><b>My Ebooks: <a href="https://zlliu.co/books">https://zlliu.co/ebooks</a></b></p><p id="1dbe"><b>My LinkedIn: <a href="https://www.linkedin.com/in/zlliu/">https://www.linkedin.com/in/zlliu/</a></b></p><p id="15fd"><b>My Workspace Setup: <a href="https://zlliu.co/workspace">https://zlliu.co/workspace</a></b></p><div id="bc39" class="link-block"> <a href="https://zlliu.medium.com/subscribe"> <div> <div> <h2>Get an email whenever Liu Zuo Lin publishes.</h2> <div><h3>Get an email whenever Liu Zuo Lin publishes. By signing up, you will create a Medium account if you don't already have…</h3></div> <div><p>zlliu.medium.com</p></div> </div> <div> <div style="background-image: url(https://miro.readmedium.com/v2/resize:fit:320/0*hwhNf4UJPjVbAKMx)"></div> </div> </div> </a> </div></article></body>

How To Draw A Wobbly Interactive Graph In Python

# Click & Drag To Make It Wobble
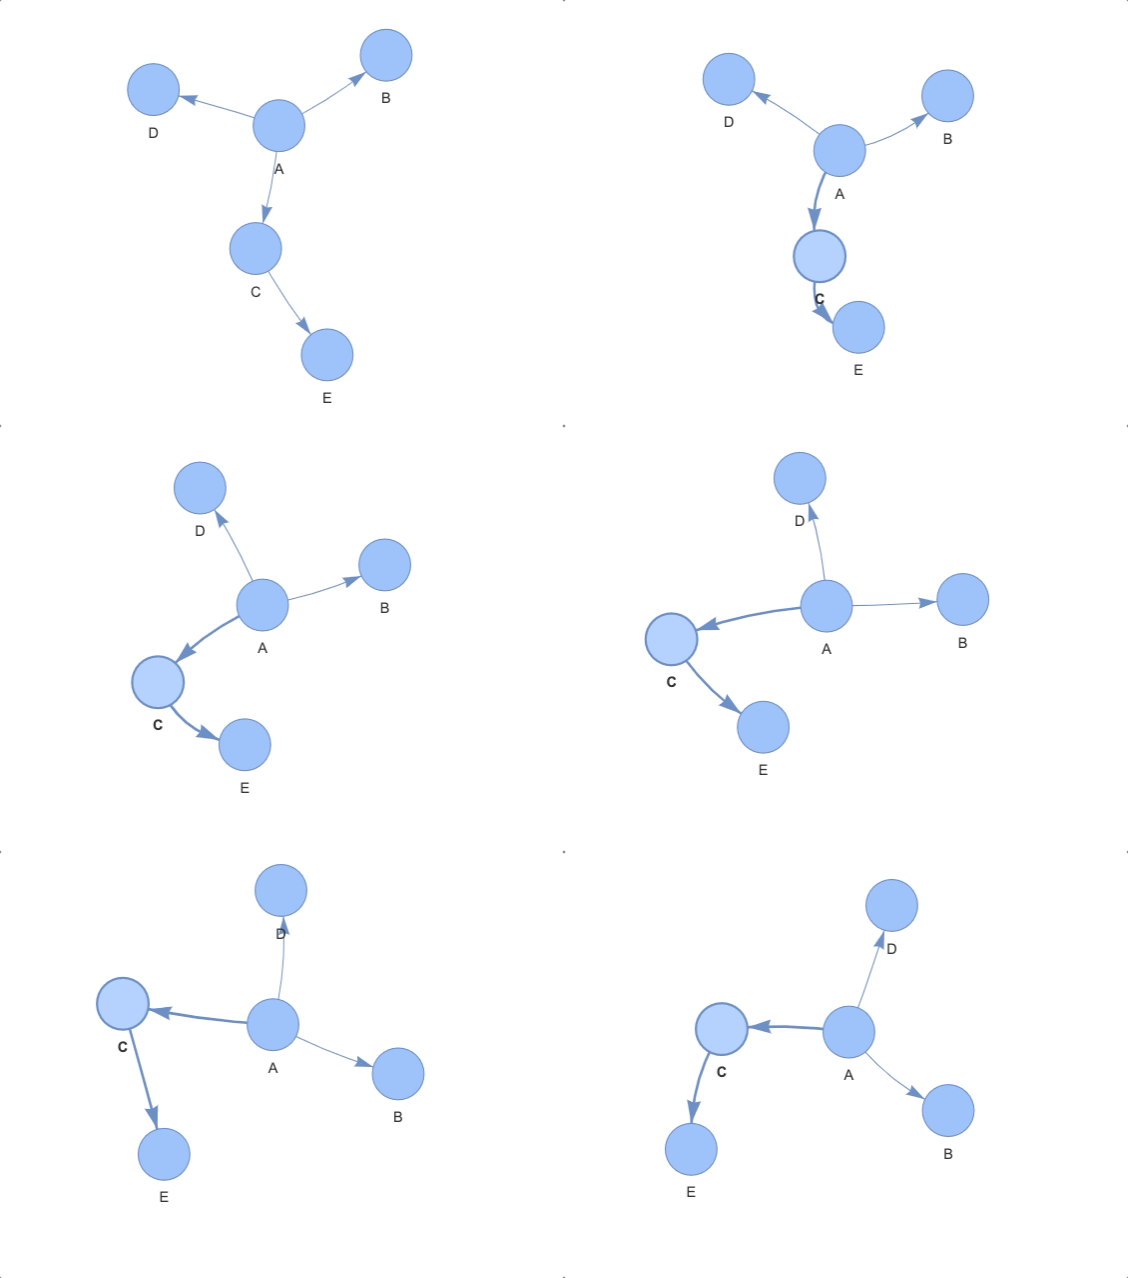
We probably know how to draw graphs, but do we know how to draw a wobbly graph like above? Let’s get started.

Installation of pyviz

We need to use an external library called pyvis. It allows us to draw wobbly graphs.

pip install pyvis

Note — pyvis with an s

Now, let’s open an empty Jupyter notebook.

1) Drawing our first node (ball)

Let’s draw our first ball labelled A. We can do this using the .add_node method.
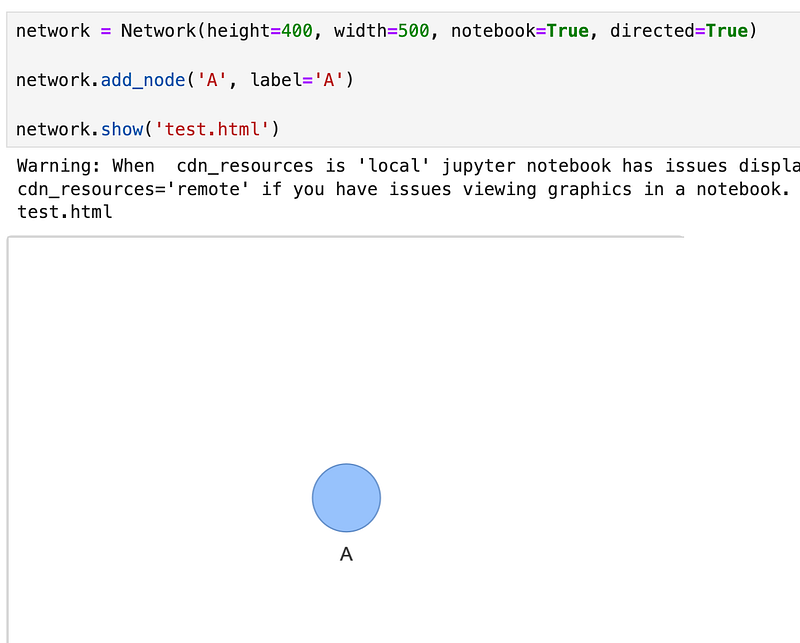
Here we have our first ball.

2) Drawing our second node

Let’s draw another ball (node) labelled B. We simply need to call the add_node method once again.
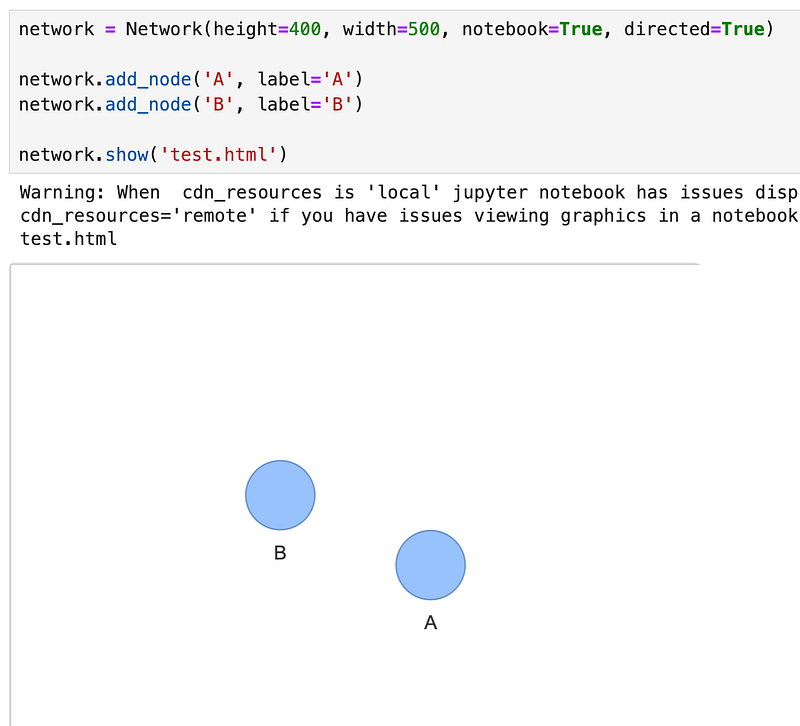
Now, we have 2 balls on the screen.

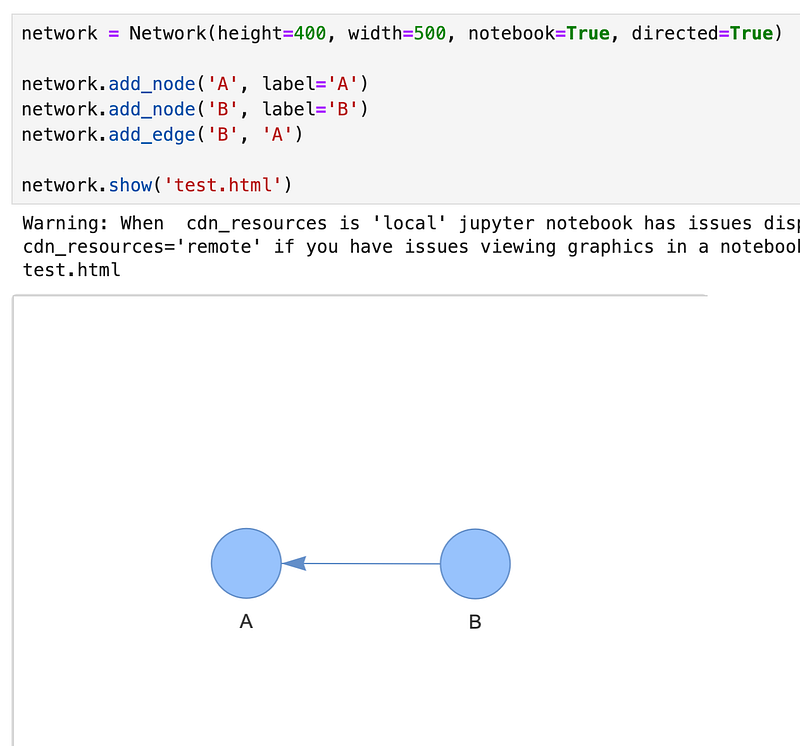
3) Let’s connect A and B — drawing our first edge

Here, and edge just means a line between the balls. We can add edges using the add_edge method.
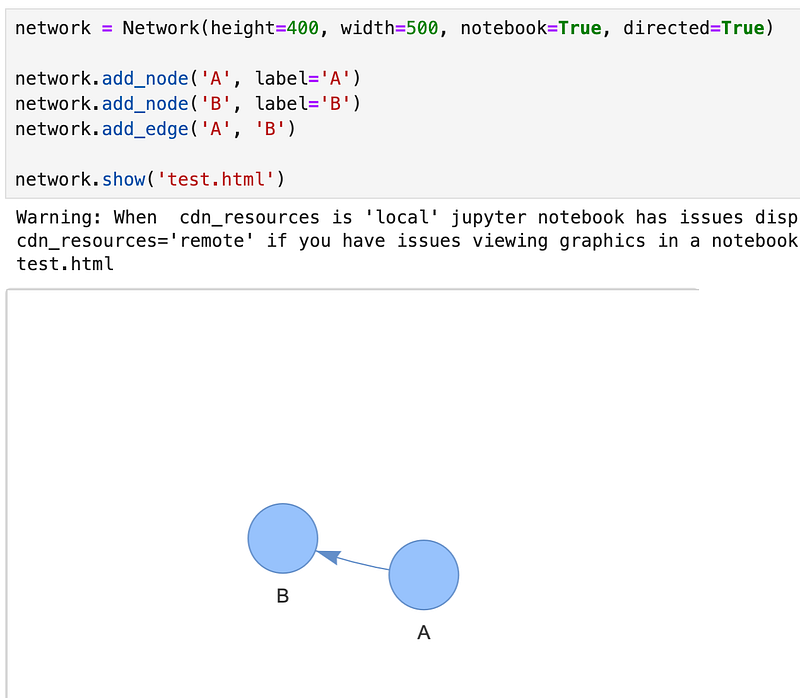
Note that in network.add_edge('A', 'B'), A comes before B which means that the arrow points from A to B. If we reverse this, we get the opposite effect.
4) Wobble it

Click on one of the balls (or the line) using your mouse, and drag it around. Notice that it wobbles and follows your mouse pointer.

5) Let’s draw more balls and lines
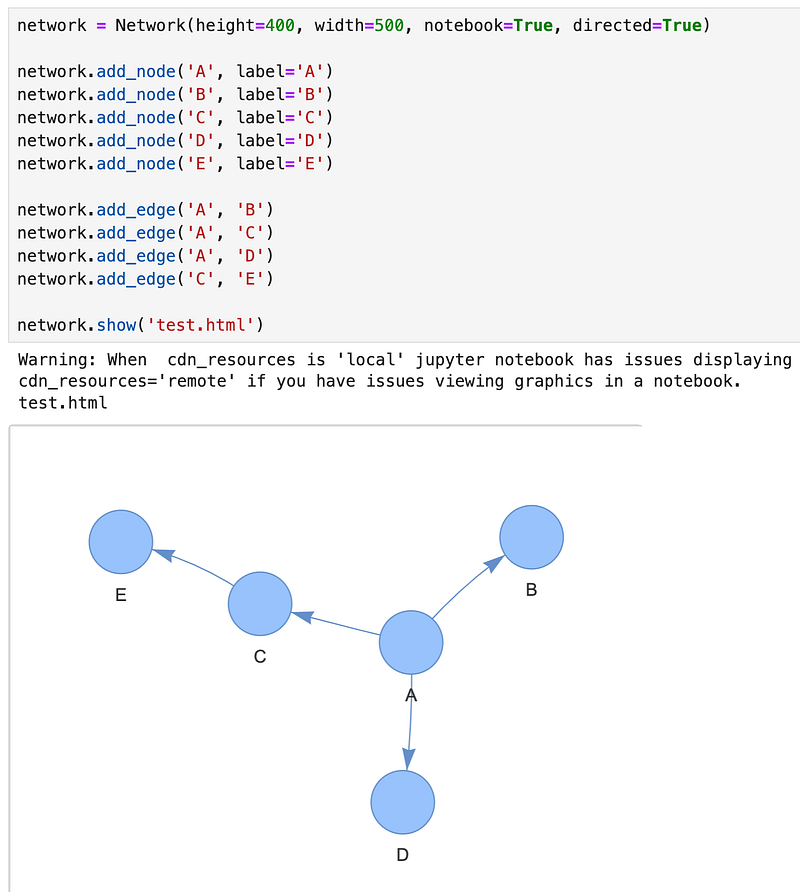
Yay, more balls and lines. But to be honest, that was quite annoying to type. Is there a way to not have to use the same function repeatedly? Yep.

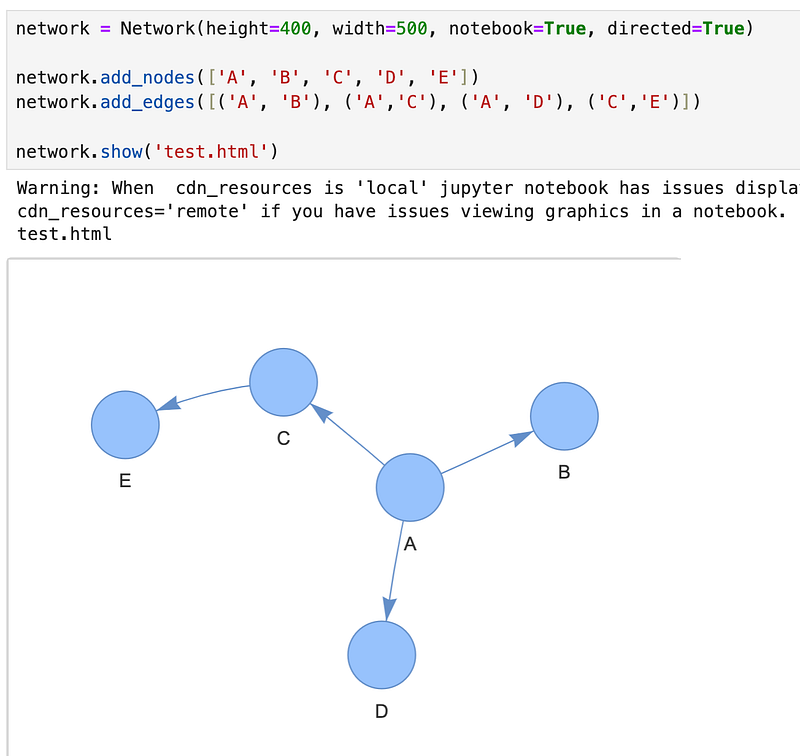
6) Using .add_nodes() and .add_edges()

If you’ve got many many nodes and lines you wish to add, consider using .add_nodes() and .add_edges() like the below example. This way, you don’t have to type out .add_node() and .add_edge() so many times.
More Tips And Tricks

  • in .add_node('A', label='A'), the label must be a string (for some reason), so if you want to use a number, remember to str(n)
  • directed=True in the first line makes this a directed graph. To make it undirected, just set directed as False.
  • you can change the height and width of the graph
  • the graph is actually saved in a HTML file test.html

Conclusion

Hope you had fun drawing wobbly graphs.

Some Final words

If this story provided value and you wish to show a little support, you could:

  1. Clap 50 times for this story (this really, really helps me out)
  2. Sign up for a Medium membership using my link ($5/month to read unlimited Medium stories)

My Ebooks: https://zlliu.co/ebooks

My LinkedIn: https://www.linkedin.com/in/zlliu/

My Workspace Setup: https://zlliu.co/workspace

Python
Programming
Graph
Jupyter
Software Engineering
Recommended from ReadMedium