
How to Download Satellite Images Without Writing a Single Line of Code
I will introduce a user-friendly platform that enables you to download satellite images or time series data for your area of interest in GeoTIFF and CSV formats — all without the need for coding.

Table of Contents
- 🌟 Introduction
- 🗺️ AppEEARS
- 🚀 Sign-up and Credentials
- 📌 Area of Interest (AOI)
- 📥 Download Satellite Images for Your AOI (Polygon)
- 📥 Download Satellite Data as Timeseries for Your AOI (Points)
- 📝 Conclusion
- 📚 References
🌟 Introduction
I enjoy coding, and one of my hobbies is reading API documents and trying to connect to an API gateway to download satellite images using Python or R scripts. Connecting to APIs through coding offers much flexibility for filtering and bulk image downloads. However, there have been moments when I wanted to test a hypothesis on a specific satellite image but I didn't have a code to download an image for that specific satellite. Also, there have been situations where my code failed, either due to changes in the API structure or the expiration of my credentials.
During such moments, I use a platform recommended by a friend, making my life much easier. I’d like to share this platform with you for downloading satellite images without dealing with APIs and writing code. The platform is called AppEEARS, and a comprehensive tutorial can be found on its website. However, the primary focus of this stroy is to introduce this web app and demonstrate some basic examples, such as downloading satellite images for your AOI or extracting time series data like NDVI for points saved as a shapefile. For a more in-depth exploration of this platform, I recommend referring to AppEEARS’s documentation page available at this link: https://appeears.earthdatacloud.nasa.gov/help
🗺️ AppEEARS
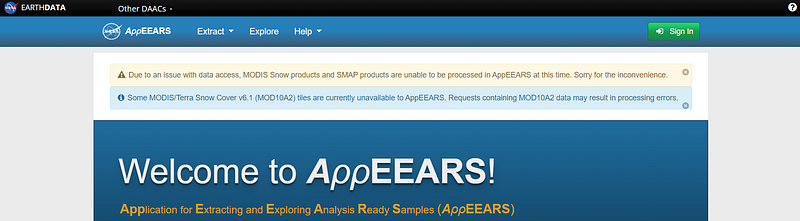
AppEEARS, short for “The Application for Extracting and Exploring Analysis Ready Samples,” is a web-based application designed to facilitate the retrieval and exploration of geospatial data from diverse data archives. Accessible at https://appeears.earthdatacloud.nasa.gov/, this user-friendly platform enables users to extract satellite images within their area of interest, either defined by points or polygons based on specific geographic coordinates. The retrieved data includes quality values, and the platform offers visualization options such as bar charts for individual images or timeseries for point extraction. Additionally, users can review summary statistics for each request before finalizing the download.
🚀 Sign-up and Credentials
The first step to access this platform is to set up your account. Open this link (https://appeears.earthdatacloud.nasa.gov/) and select “Sign In”:
If you already have a NASA Earthdata account, you can use it to log in to AppEEARS. Otherwise, you can create a new account by clicking on “Register.” Complete the registration process and login with your credentials.
📌 Area of Interest (AOI)
AppEEARS can either clip satellite images for your Area of Interest (AOI) if it’s a polygon or extract band values from satellite images if your shapefile is a point or contains multiple points. The initial step includes creating your AOI, saving it as a shapefile, zipping it, and preparing it for AppEEARS. If you’re unfamiliar with how to create a shapefile for your AOI in QGIS, you can check out these sections (🌐 Install the QuickMapServices plugin, 🛠️ Create a shapefile in QGIS) in the following link, where all the necessary steps are detailed:
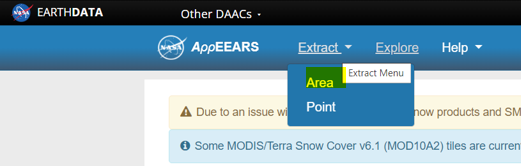
📥 Download Satellite Images in GeoTIFF Format for Your AOI
After creating a polygon for your AOI, click on “Extract” and select ‘Area’:
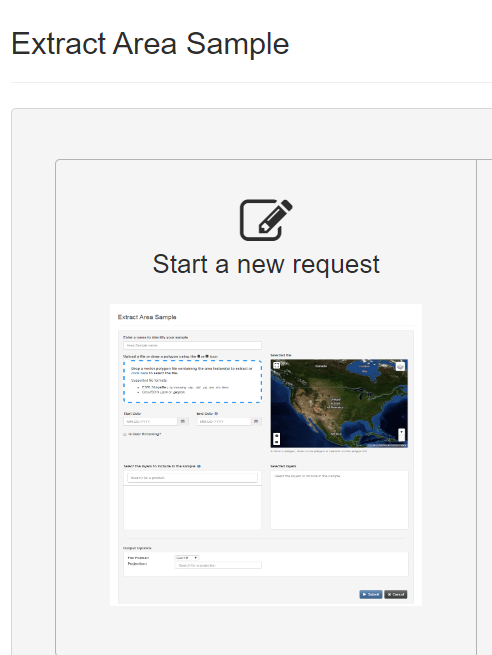
Next, click on “Start a new request”:
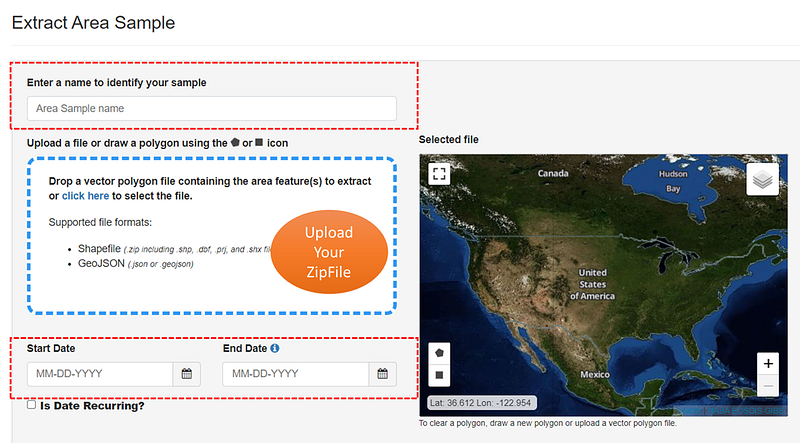
Next, provide a name for your request, upload the zipped shapefile folder from your local machine to the blue box, and specify the start and end dates for the sensing period (for example 06–10–2023 to 06–20–2023).
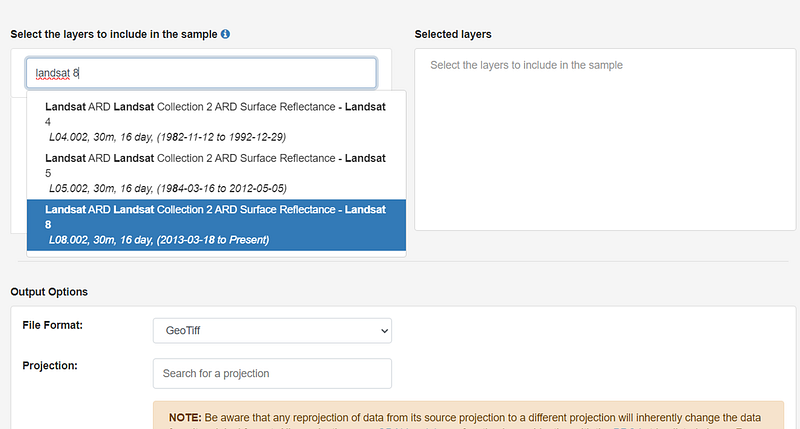
Scroll down to locate the layers options. In this section, you will find a list of all available data archives, such as MODIS, Landsat, ECOSTRESS, etc. For example, type “Landsat 8” and select Landsat ARD Collection surface Reflectance:
Now, choose the SR_B4, SR_B3, and SR_B2 bands, which are Red, Green, and Blue channels in Landsat-8, respectively.
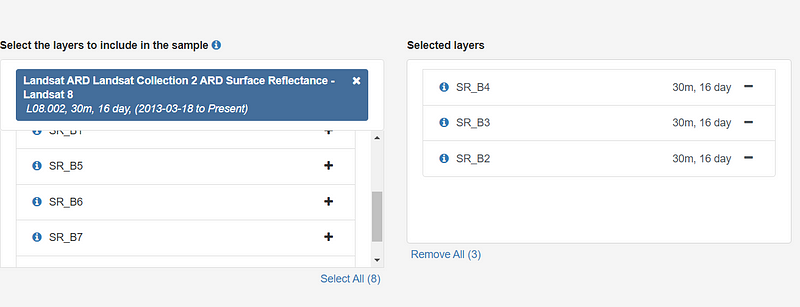
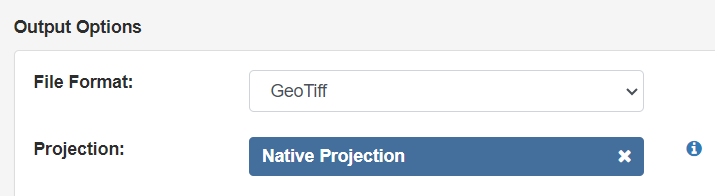
Once you have completed these steps, keep the Geotiff format for the file format, and select the native projection in the projection options.
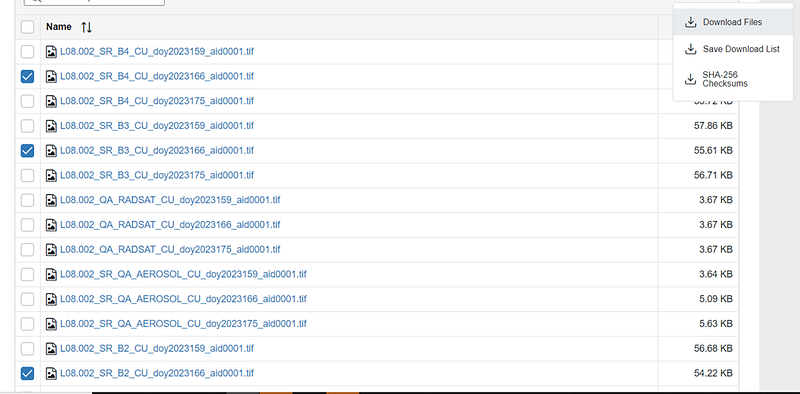
You can now submit your request. The processing time will depend on the size of the request (number of images based on start date and end date, and the size of AOI). Once the request is completed, you can view the outputs in the “Explore” tab:
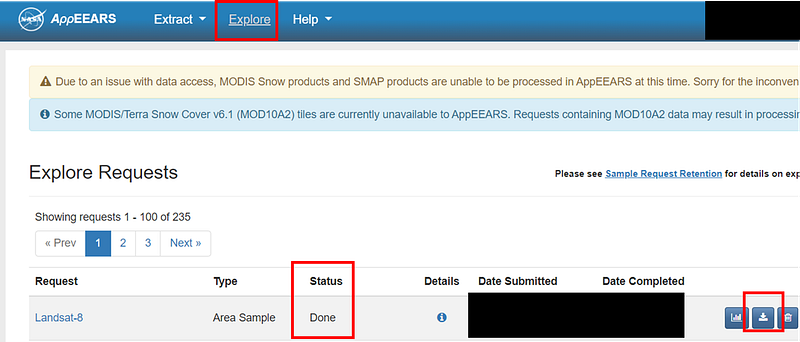
Click the “Download Files” button to retrieve and download your raw images.
Let’s write a simple Python code to visualize the three RGB bands from a Landsat-8 image captured over my AOI:
pip install rasterio
import rasterio
import numpy as np
from rasterio.plot import show
import matplotlib.pyplot as plt


# Open B2, B3, and B4 Landsat-8 raster files
b4 = rasterio.open('/content/Landsat-8/L08.002_SR_B4_CU_doy2023166_aid0001.tif')
b3 = rasterio.open('/content/Landsat-8/L08.002_SR_B3_CU_doy2023166_aid0001.tif')
b2 = rasterio.open('/content/Landsat-8/L08.002_SR_B2_CU_doy2023166_aid0001.tif')


# Read the data from the raster files
b4_data = b4.read(1)
b3_data = b3.read(1)
b2_data = b2.read(1)

# Stack the bands into a single 3D array
rgb = np.stack((b4_data, b3_data, b2_data), axis=0)

# Normalize the data to the 0-1 range
rgb = rgb / np.max(rgb)

# Display the RGB map
show(rgb)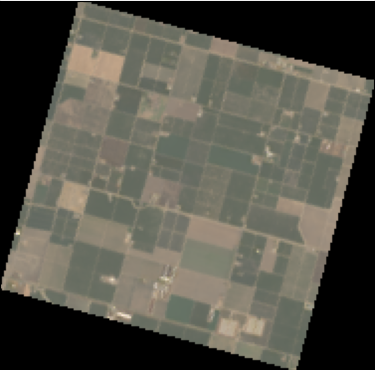
📥 Download Satellite Data as Timeseries for Your AOI
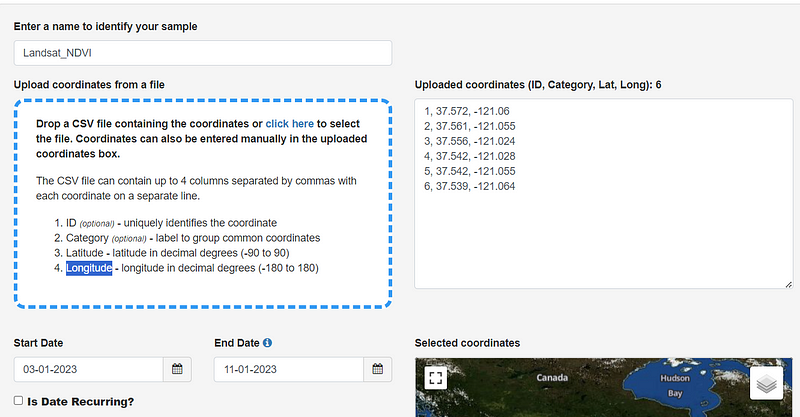
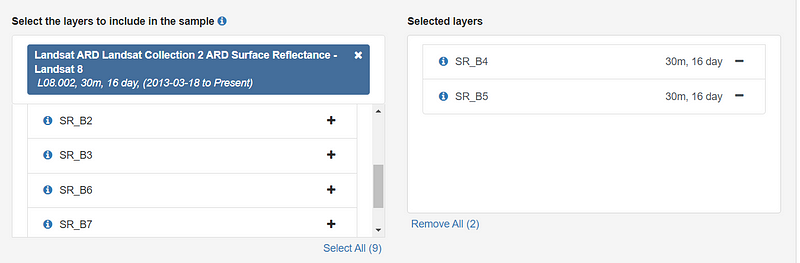
In this step, I repeat all the previous steps, but this time, I upload a CSV file containing coordinates for 6 points within my AOI and select only two bands of Landsat 8 (Red and NIR for calculating NDVI).
Also, I adjust the start date and end date to cover the period from March 1st, 2023, to November 1st, 2023.
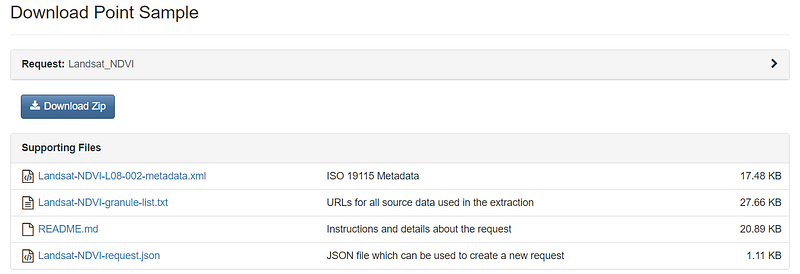
Similar to Geotiff files, after completing the request, you can click on the download icon to retrieve your CSV file having a timeseries of the Red and NIR bands of Landsat 8 for the specified points:
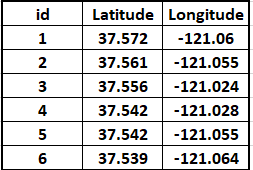
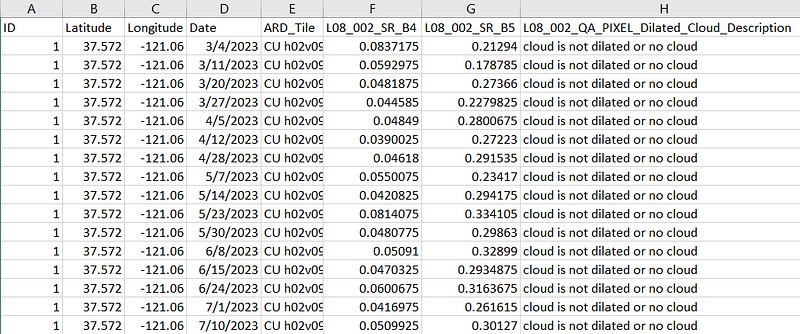
If you open the CSV file in Microsoft Excel, you will see a table like this:
Let’s once again write a Python code to plot the timeseries of NDVI for three of those 6 points:
import pandas as pd
import matplotlib.pyplot as plt

# Load the CSV file
file_path = 'Landsat-NDVI-L08-002-results.csv'  # Replace with your actual file path
df = pd.read_csv(file_path)

# Calculate NDVI
df['NDVI'] = (df['L08_002_SR_B5'] - df['L08_002_SR_B4']) / (df['L08_002_SR_B5'] + df['L08_002_SR_B4'])

# Convert 'date' column to datetime format
df['date'] = pd.to_datetime(df['Date'])

# Plot NDVI time series for each point in one plot
plt.figure(figsize=(10, 5))

unique_ids = df['ID'].unique()

for point_id in unique_ids:
    subset = df[df['ID'] == point_id]
    plt.plot(subset['date'], subset['NDVI'], label=f'Point {point_id}')

plt.title('NDVI Time Series')
plt.xlabel('Date', fontweight='bold')
plt.ylabel('NDVI', fontweight='bold')
plt.legend(prop={'weight':'bold'})
plt.show()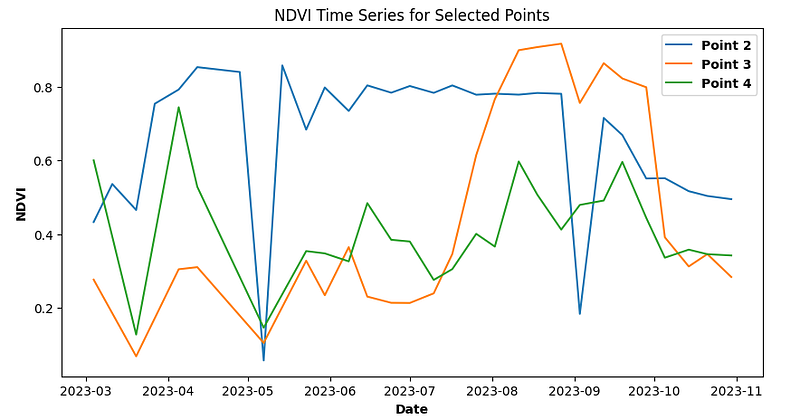
In my AOI, Point 2 (the blue line) is considered as a grassland. The NDVI values for Point 2 are consistently above 0.4 throughout the entire year, indicating the presence of healthy vegetation or dense vegetation cover. The two significant drops in NDVI for Point 2 (the blue line) can be attributed to either bad quality pixels in the satellite imagery or the occurrence of activities such as mowing the grassland.
Point 3 (the orange line) was for the seasonal crop. It shows a typical pattern and trend, with an increase during the growing season and a drop after the harvest date. This pattern aligns with the expected NDVI timeseries in agricultural areas.
Point 4 (the green line) is in the middle of bare soil. The NDVI values for Point 4 are relatively consistent throughout the year, as expected for areas without significant vegetation cover.
📝 Conclusion
There are various methods to access satellite images, ranging from coding on a local machine to utilizing cloud computing services like Google Earth Engine or web applications. Each approach has its own set of advantages and disadvantages, depending on your specific needs.
Web applications, such as AppEEARS, are excellent platforms for those who prefer not to write code. AppEEARS provides a user-friendly environment, requiring only inputs such as your AOI, start and end dates, and the specific satellite images you wish to download. This makes it an ideal option for users who want to download satellite images without the need to write a single line of code.
I hope you find this information helpful and enjoy downloading satellite images using AppEEARS for your case study. For additional information about this platform, please refer to the links provided in the reference section.
📚 References
https://appeears.earthdatacloud.nasa.gov/api/
https://appeears.earthdatacloud.nasa.gov/help
- 📱 Connect with me on other platforms for more engaging content! LinkedIn, ResearchGate, Github, and Twitter.
Here are the relevant posts available through these links:


