
How to get historic Crypto 1 Minute Price data for Free (Python)

Photo by André François McKenzie on Unsplash.com
If you are looking for a way to download historic crypto price data for free for strategy development, back testing or visualization, this post is for you.
This approach is using the Yahoo Finance module and Python. The documentation for Yahoo Finance here.
Yahoo! and Yahoo! finance are registered trademarks of Yahoo, Inc.
Please refer to Yahoo!’s terms of use (link1, link2, and link3) for details on your rights to use the actual data downloaded. The Yahoo! finance API is intended for personal use only.
This story is solely for general information purposes, and should not be relied upon for trading recommendations or financial advice. Source code and information is provided for educational purposes only, and should not be relied upon to make an investment decision. Please review my full cautionary guidance before continuing.
You can find a full Jupyter Notebook of the solution at the end of the post.
Implementation
First, let’s go ahead and import a few Python libraries. If you don’t have these libs installed, now would be a great time to go ahead and do so.
import os
import numpy as np
import pandas as pd
import datetime
import time
from datetime import date
import pandas_ta as ta
import matplotlib.pyplot as plt
import plotly.graph_objects as go
from plotly.subplots import make_subplots
from yahoo_fin import stock_info as si
import datetime
import yfinance as yf
from random import randint
from time import sleep
Next, we will be calling the yfinance function ‘download()’ with parameters for start date, end date, period, interval and prepost market.
Please note that the maximum date range for retrieving minute period data for crypto is 7 days.
Here are the valid period parameters:
1d,5d,1mo,3mo,6mo,1y,2y,5y,10y,ytd,maxAnd these are the valid interval parameters:
1m,2m,5m,15m,30m,60m,90m,1h,1d,5d,1wk,1mo,3moFor details about the input parameters for the Yahoo Finance download function, please refer to the documentation.
This is the function that performs the downloads based on the input parameters.
def load_historic_data(symbol, start_date_str, today_date_str, period, interval, prepost):
    try:
        df = yf.download(symbol, start=start_date_str, end=today_date_str, period=period, interval=interval, prepost=prepost)
        #  Add symbol
        df["Symbol"] = symbol
        return df
    except:
        print('Error loading stock data for ' + symbols)
        return None
Next, we want to define all the input parameters and specify the coins for which we want to download data.
# valid periods: 1d,5d,1mo,3mo,6mo,1y,2y,5y,10y,ytd,max
# fetch data by interval (including intraday if period < 60 days)
        # valid intervals: 1m,2m,5m,15m,30m,60m,90m,1h,1d,5d,1wk,1mo,3mo
period = '1d'
interval = '1m'
prepost = True
today = datetime.date.today()
today_date_str = today.strftime("%Y-%m-%d")
# NOTE: 7 days is the max allowed
days = datetime.timedelta(7)
start_date = today - days
start_date_str = datetime.datetime.strftime(start_date, "%Y-%m-%d")# Coins to download
symbols = ['BTC-USD','ETH-USD','BCH-USD','LTC-USD','BNB-USD','BAT-USD',
'XLM-USD','DOGE-USD','DOGE-USD','COMP-USD','ALGO-USD','OMG-USD']Once the data is downloaded, we are saving it into a csv file for later processing.
Instead of fetching the data for each coin separately, you could also pass the array of coins into the yf.download function and get a df with data for all coins.
As you can see I’m also adding a random sleep between the calls to avoid spam DOS issues.
#  Fetch data for coin symbols
for symbol in symbols:
    print(f"Loading data for {symbol}")
    df = load_historic_data(symbol, start_date_str, today_date_str, period, interval, prepost)
    #  Save df
    file_name = f"{today_date_str}_{symbol}_{period}_{interval}.csv"
    df.to_csv(f"C:\\dev\\trading\\tradesystem1\\data\\crypto\\{file_name}")

    #  Avoid DOS issues
    sleep(randint(0,3))
Here is a plot function using mathplotlib and plotly to visualize the downloaded data.
def plot_graph(df):
    fig = make_subplots(rows=1, cols=1)
# Plot close price
fig.add_trace(go.Line(x = df.index, y = df['Close'], line=dict(color="blue", width=1), name="Close"), row = 1, col = 1)
fig.update_layout(
title={'text':'7 days, 1m interval', 'x':0.5},
autosize=False,
width=800,height=400)
fig.update_yaxes(range=[0,1000000000],secondary_y=True)
fig.update_yaxes(visible=False, secondary_y=True) #hide range slider
fig.show()And here an example of how to call the plot function for Bitcoin:
df = load_historic_data('BTC-USD', start_date_str, today_date_str, period, interval, prepost)
plot_graph(df)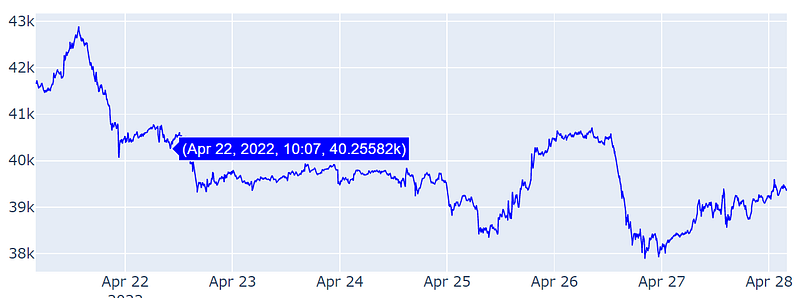
And that’s it. You now have 1 minute Crypto data for the last 7 days which you can now use for things like backtesting, strategy development or visualization.
Trade Ideas provides AI stock suggestions, AI alerts, scanning, automated trading, real-time stock market data, charting, educational resources, and more. Get a 15% discount with promo code ‘BOTRADING15’.
Wrapping up
In this post we went over the steps on how to download historic crypto price data in minute intervals for free using Python libraries.
Next, we added a way to visualize the data using Python matplotlib and plotly libraries.
You can find a complete Jupyter Notebook of the implementation on my GitHub repository here.
I hope you found this post worth your time. Thanks for reading.
You can support my writing for free using this link. Don’t miss another story — subscribe to my stories by email. For more premium content, check out my ‘B/O Trading Blog’ on Substack.
This post contains affiliate marketing links.
Have a great day!


