How to Download and Explore Movie Data
Using the TMDB API and python to explore the 2022 Oscar nominees using network analysis
It’s Moira Rose’s favorite season again — Awards! I thought this would be a great opportunity to do some network analysis on the 2022 Oscar nominees and play around with the TMDB API. This tutorial will take you through:
- querying the TMDB API for full lists of cast and crew for all of the 2022 Oscar nominated films,
- extracting a network from the data,
- and doing some simple data analysis and network analysis on the extracted graph
Enjoy and feel free to comment on the bottom with any questions or issues you have! Here is a link to the code on my GitHub if you want to use that as a reference.
Querying the TMDB API
First, thanks to Monica Powell for this article that helped me understand the TMDB API.
To get started, you’ll need to go to the TMDB site and get an API key. To get an API key, just go to the site, register a new account, and use your new account to generate a new API key. They make it pretty straightforward and I had no issues getting a key quickly.
Once you have your key, create a config.py file and put your key in there with the code:
tmdb_api_key = "YOUR API KEY”This isn’t strictly necessary, but it’s a good idea of getting in the habit of storing your API keys in a config file rather than directly in your code, especially if you are going to be posting this on GitHub. You don’t want to share your API key with anyone so putting the key in a separate file allows you to share your code without sharing your key.
Now we can start pulling data from TMDB and working with it in a Jupyter Notebook. First, let’s import our packages:
import config # to hide TMDB API keys
import requests # to make TMDB API calls
locale.setlocale( locale.LC_ALL, '' )
import pandas as pd
import matplotlib.pyplot as plt
import itertools
from pandas import json_normalize
import networkx as nx
import datetimeapi_key = config.tmdb_api_key # get TMDB API key from config.py fileThe Movie Database API has great documentation here. I found this tutorial by Tessa Xie to be very helpful in understanding how to run different queries using this API.
For the purposes of this tutorial, we are interested in the ‘credits’ of movies i.e. full lists of cast and crew. To get this info, we can use a query like this:
#Test API by pulling full credits for "Dune"
query = "https://api.themoviedb.org/3/movie/" + "438631" + "/credits?api_key=" + api_key + "&language=en-US"
response =  requests.get(query)
array = response.json()
This gets all the credits for the movie ‘Dune’ from TMDB and puts it into JSON format. The JSON has two components: cast and crew. We can extract the full cast list into a pandas DataFrame using the following code:
#Get full cast and put into a pandas DF
temp_cast = json_normalize(array, 'cast')
Now we have a DataFrame of the entire cast from Dune. To view this data as a network, we need to transform the data. We want to draw a connection from each person in the cast list to each other person. The quickest way I have found to do this is with the following code:
#Turn dataframe into a dyadic dataset that we can turn into a graph
dyads_cast = pd.DataFrame(list(itertools.combinations(temp_cast['name'], 2)))
dyads_cast = dyads_cast.drop_duplicates()
dyads_cast.columns = ['source','target']
This creates a DataFrame of ‘edges’ — each actor gets a connection to every other actor. For just one movie, this isn’t very interesting. We can create a simple visualization of this network by turning the DataFrame into a graph using the NetworkX package and visualizing using matplotlib.
#Turn df into graph using NetworkX
G = nx.from_pandas_edgelist(dyads_cast, 'source', 'target')
pos = nx.spring_layout(G)
f, ax = plt.subplots(figsize=(10, 10))
plt.style.use('ggplot')
nodes = nx.draw_networkx_nodes(G, pos,
alpha=0.8)
nodes.set_edgecolor('k')
nx.draw_networkx_labels(G, pos, font_size=18)nx.draw_networkx_edges(G, pos, width=1.0, alpha=0.2)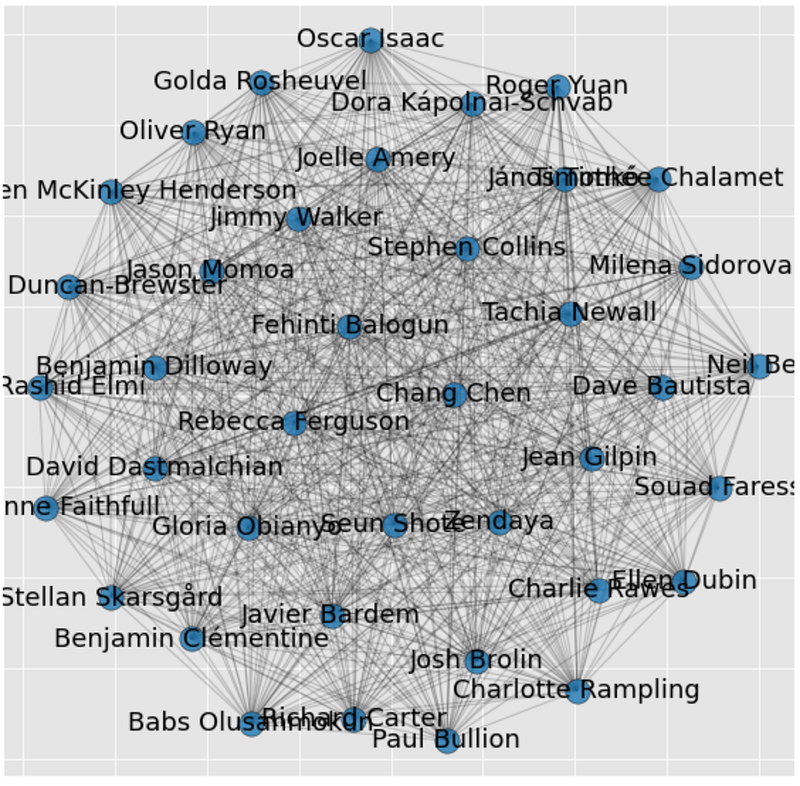
Pulling all Oscar noms from the API
Like I said, it’s not interesting to look at this kind of network for one movie. We need the full list of Oscar nominees. As far as I can tell, there isn’t an easy way to get these lists in formats that make a TMDB query possible, so I made my own list manually. I have attached it to my GitHub if you want to use it for this tutorial.
movies = pd.read_csv("oscars.csv")
#There is no data for the movie Ascension so I exclude to avoid errors later
movies = movies.loc[movies['original_title'] != "Ascension"]
Now for the fun part. We want to loop through this list of 2022 Oscar Noms and get the full cast and crew of each, then append each of them to a DataFrame. The code below loops through the movie list we made, queries TMDB, extracts a DataFrame for the cast and crew, then appends them to a full_cast_df and a full_crew_df.
#Create empty DataFrames to append to
full_cast_df = pd.DataFrame()
full_crew_df = pd.DataFrame()
#Loop through movie list
for index, row in movies.iterrows():
movie_id = row['id']
#Query TMDB for cast and crew for movie
query = "https://api.themoviedb.org/3/movie/" + str(movie_id) + "/credits?api_key=" + api_key + "&language=en-US"
response = requests.get(query)
if response.status_code==200:
#status code ==200 indicates the API query was successful
array = response.json()
title = row['original_title']
#Create DataFrames for this movies cast and crew lists
temp_cast = json_normalize(array, 'cast')
temp_crew = json_normalize(array, 'crew')
#Create a new column called 'movie' where we put the title of the movie
temp_cast = temp_cast.assign(movie=title)
temp_crew = temp_crew.assign(movie=title)
#Append individual movies cast and crew list to the main dataframe so we have one with all of them
full_cast_df = pd.concat([full_cast_df, temp_cast])
full_crew_df = pd.concat([full_crew_df, temp_crew])You may want to explore the cast and crew lists separately, but for this tutorial I am just going to combine them into one list of full cast and crew:
fullCastAndCrewDF = pd.concat([full_cast_df,full_crew_df])One issue with combining these is that crew has a column called ‘role’ where their role on the film is described, while the cast has a column called ‘character’ with the name of their character. We want one column where we can know what this person’s role is for the movie:
def getRole(x):
    if pd.isnull(x['character']) == True:
        return(x['movie'] + ": " + x['job'])
    else:
return(x['movie'] + ": " + "Actor " + x['character'])fullCastAndCrewDF['role'] = fullCastAndCrewDF.apply(lambda x: getRole(x), axis = 1)Some data analysis on our data
Before we even start creating a big network of all these people and running network analytics on the graph, we can answer some questions using just this DF, such as, ‘who was in the most 2022 Oscar nominated movies?’
The code below groups the DF by name and role (across all movies), and then sorts by the most prolific people.
prolifics = fullCastAndCrewDF.groupby(['name']).agg({'movie':lambda x: list(x), 'role':lambda x: list(x)})
prolifics['freq'] = prolifics['movie'].apply(lambda x: len(x))
pd.set_option("display.max_colwidth", -1)
prolifics.sort_values('freq',ascending=False).head(10)
Here are my results:
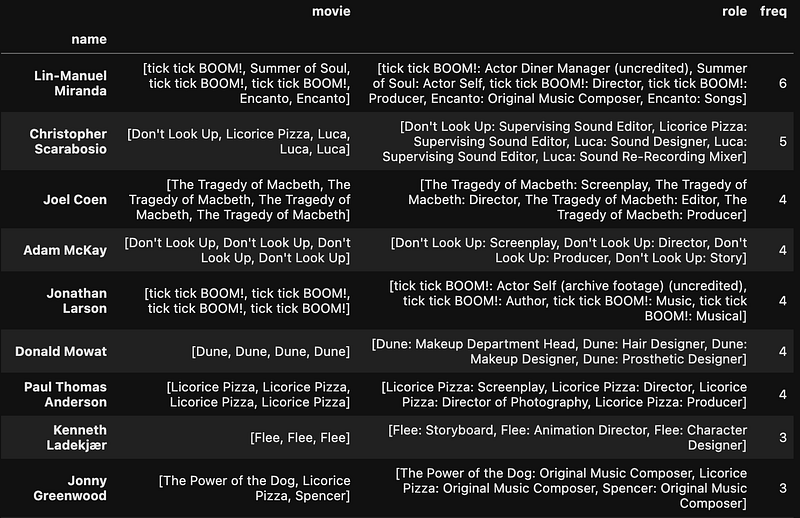
The most prolific person on our list is Lin-Manuel Miranda. He produced, directed, and had a small role in Tick, Tick, BOOM!, while also writing and composing songs for Encanto. He also had a part in the documentary Summer of Soul as himself, for a total of 6 credits in 2022 Oscar noms.
There are several people on this list who had multiple credits in the same film. Paul Thomas Anderson produced, directed, wrote, and was the cinematographer for Licorice Pizza, for example. What if we exclude multiple roles on the same film?
fullCastAndCrewDF_noDupes = fullCastAndCrewDF.drop_duplicates(['name','movie'])
prolifics2 = fullCastAndCrewDF_noDupes.groupby(['name']).agg({'movie':lambda x: list(x), 'role':lambda x: list(x)})
prolifics2['freq'] = prolifics2['movie'].apply(lambda x: len(x))
pd.set_option("display.max_colwidth", -1)
prolifics2.sort_values('freq',ascending=False).head(15)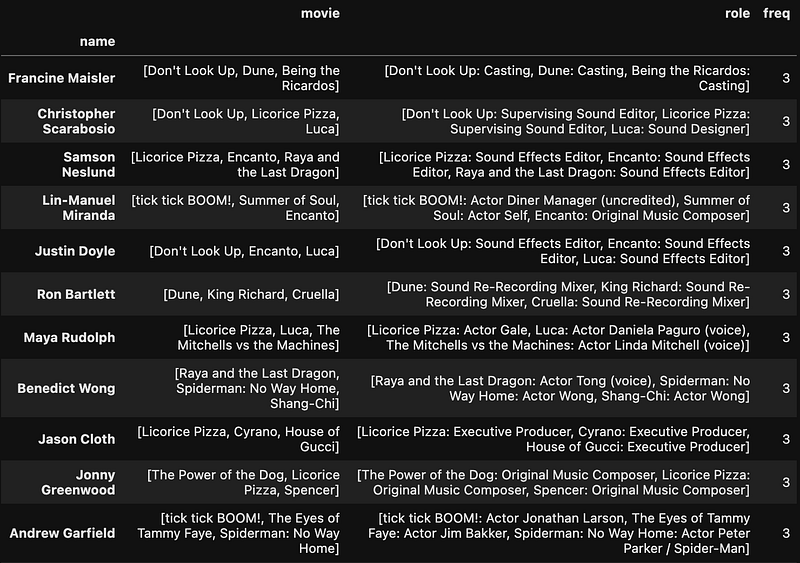
This is the complete list of people who worked on 3 different Oscar nominated films. There are only three actors who were in three films: Maya Rudolph, Andrew Garfield, and Benedict Wong. Jonny Greenwood was the composer on three films, which is bananas, but several other people also worked on three different Oscar nominated films.
Extracting a network from the data
Now that we have a DataFrame with everything we want, we can extract a network and run some network analysis on it. There are two ways we can extract this network: we can consider movies as nodes and people as the connections (or edges) between them, or we can consider people as nodes and movies as edges. First, let’s create a network of movies as nodes.
#Create a list of all people
fullCastAndCrew = list(fullCastAndCrewDF['name'].drop_duplicates())
#Create an empty DataFrame to append to
movie_network = pd.DataFrame()
for x in fullCastAndCrew:
#Filter DF for this person
temp = fullCastAndCrewDF.loc[fullCastAndCrewDF['name'] == x]
#Create a dyadic dataset for this person between the movies they are in
dyads = pd.DataFrame(list(itertools.combinations(temp['movie'], 2)))
#Create a column called 'name' for the person's name
dyads = dyads.assign(name = x)
#Concat this person's data onto our master DF
movie_network = pd.concat([movie_network,dyads])
#Rename columns
movie_network.columns = ['name','source','target']#Get rid of self references
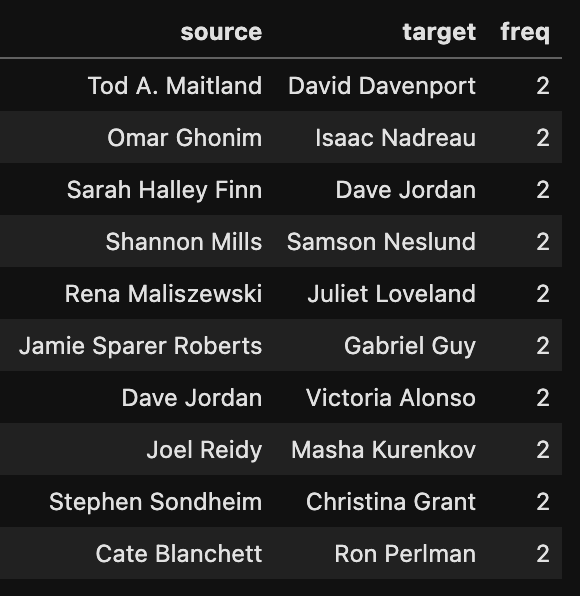
movie_network = movie_network[movie_network['source'] != movie_network['target']]The code above creates a list of all of our movies (fullCastAndCrew), loops through the list and creates a dyadic dataset of links between movies, where each link is a person who plays a part or has a job on both of the films. Once created, the DF should look something like this:
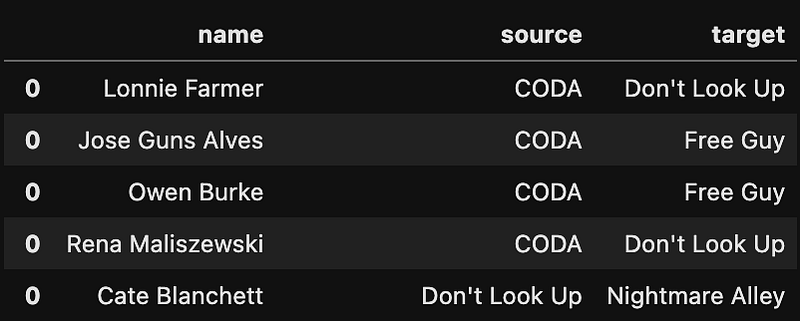
This means Cate Blanchett was in both Don’t Look Up and Nightmare Alley. With this dataset, we can create a visualization of a network. First, export the network as a csv file:
movie_network.to_csv("movie_network.csv")I use Gephi to visualize networks because it is easier than writing all the code and they look pretty awesome. Gephi is an open-source network analysis and visualization software. You should be able to easily install it for free from their website. It’s pretty easy to get started and allows for some really beautiful visualizations. If you have never used Gephi, here is a good tutorial to get started from Luca Hammer.
It does appear that there are connections between most of the movies on our list, but are there any movies that are completely disconnected from this graph? To check for these ‘orphan’ movies, first we create a list of the movies in the network and remove duplicates.
#Create a list of all movies in the network to see if any are not connected at all
movie_network_movies = movie_network['source'].tolist() + movie_network['target'].tolist()
#Remove duplicates
movie_network_movies = set(movie_network_movies)Then we compare this list to our original list of all Oscar nominated movies:
#Compare network list of movies to original list to find orphans
originalList = movies['original_title'].tolist()
non_connected_movies = list(set(originalList) - set(movie_network_movies))
non_connected_movies
There are four orphan movies: ‘Parallel Mothers’, ‘Lunana: a Yak in the Classroom’, ‘Drive My Car’, and ‘Writing with Fire’. There are also two movies, ‘Flee’ and ‘The Worst Person in the World,” that are connected to each other, but to no other films — Eskil Vogt wrote ‘The Worst Person in the World,’ and was a script consultant on ‘Flee.’
If you want to create a column that describes the person’s job on both of the films in each edge, I wrote the following function:
#Put description of person's role in both movies into a new column
def getDescription(x):
    name = x['name']
    roleInSource = fullCastAndCrewDF.loc[(fullCastAndCrewDF['name'] == name) & (fullCastAndCrewDF['movie'] == x['source'])]['role'].values[0]
    roleInTarget = fullCastAndCrewDF.loc[(fullCastAndCrewDF['name'] == name) & (fullCastAndCrewDF['movie'] == x['target'])]['role'].values[0]
    roles = [roleInSource,roleInTarget]
return(roles)movie_network['connection_description'] = movie_network.apply(lambda x: getDescription(x), axis = 1)This gives us output that looks like this:

Here, we can see that Cate Blanchett played the character Brie Evantree in Don’t Look Up and Lilith Ritter in Nightmare Alley. I just found myself interested in finding how a person was connected to multiple films and this column made that a bit easier.
So which movie is the most ‘connected’ to other Oscar nominated movies? There are several ways to answer this question. First, we can find which two movies are the most connected.
#Which movies are most connected?
movie_network = movie_network.groupby(["source", "target"]).size().reset_index(name="freq")
movie_network.sort_values('freq',ascending=False).head(10)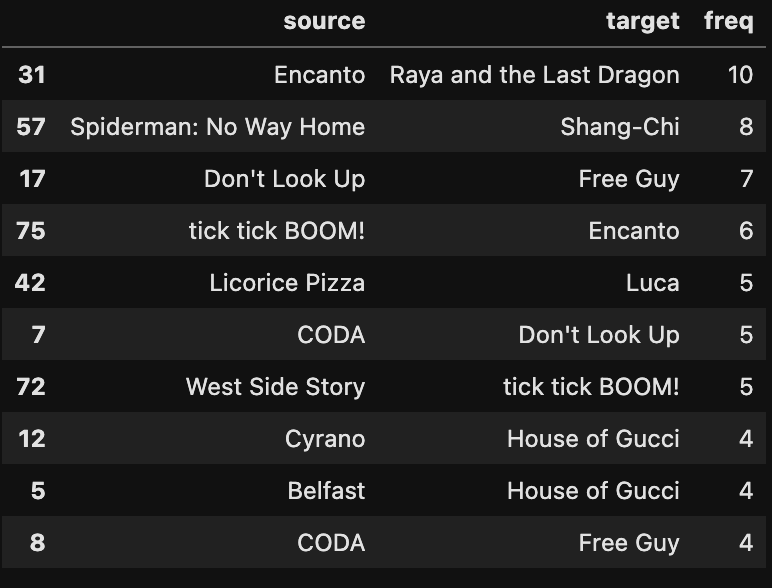
Perhaps not surprisingly, the two animated Disney movies have the most connections between them.
We can also calculate the total number of ‘degrees’ of each node i.e. the number of people in each movie that are also in at least one other Oscar nominated movie:
#Turn df into graph using NetworkX
G = nx.from_pandas_edgelist(movie_network, 'source', 'target', edge_attr='freq')
#Find the degree of everyone in the network
G_sorted = pd.DataFrame(sorted(G.degree, key=lambda x: x[1], reverse=True))
G_sorted.columns = ['movie','degree']
G_sorted.head()This gives us the following list:
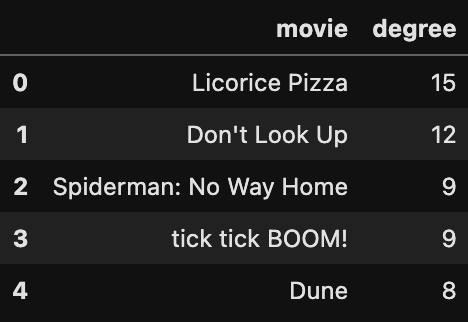
There are 15 connections in the cast and crew list of Licorice Pizza who are also in other movies on our list. If you want to see the full list of connections between Licorice Pizza and other films you can use this code (or go to the notebook on my GitHub):
#Show all connections between Licorice Pizza and all the other movies on our list
movie_network.loc[(movie_network['source'] == "Licorice Pizza") | (movie_network['target'] == "Licorice Pizza")]
Create a network where people are nodes and movies are edges
Now let’s create a network where people are nodes and their connections are movies.
#Create an empty DataFrame
people_network = pd.DataFrame()
#Loop through movies and create dyads between all people in each movie
for x in movies['original_title']:
#Filter df for movie
temp = fullCastAndCrewDF.loc[fullCastAndCrewDF['movie'] == x]
#Create pairs of all people in the movie
dyads = pd.DataFrame(list(itertools.combinations(temp['name'], 2)))
#Create a new column called 'movie'
dyads = dyads.assign(movie = x)
#Concat network to master df
people_network = pd.concat([people_network,dyads])The code above loops through all the movies and creates pairs of all the people in each of the movies — these pairs are our ‘edges’ in the graph. Then we can rename the columns and get rid of self-references i.e. when a person is connected to themselves.
#Rename columns
people_network.columns = ['source','target','movie']
#Get rid of self references
people_network = people_network[people_network['source'] != people_network['target']]
Similar to the question above — what if we wanted to find the two people with the most connections between them?
#Which two people are the most connected?
people_network = people_network.groupby(["source", "target"]).size().reset_index(name="freq")
people_network.sort_values('freq',ascending=False).head(10)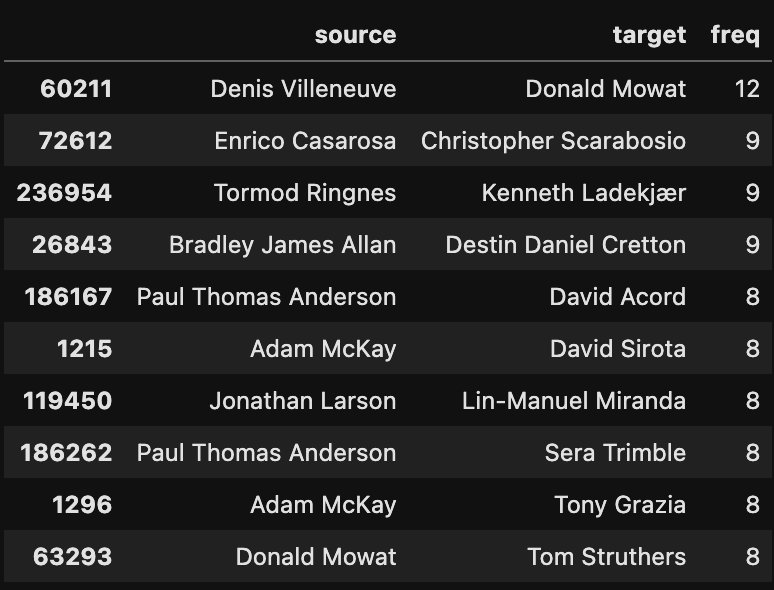
We can see that Donald Mowat and Denis Villeneuve have 12 connections between them. This is because Denis Villeneuve had three credits on Dune (writer, director, and producer) and Donald Mowat had four credits on Dune (makeup department head, hair designer, makeup designer, and prosthetic designer). This may be misleading since these two people, while having multiple roles, are really only two people. What if we drop duplicate roles within the same movie and calculate the frequency of connections again?
#Drop duplicates
people_network_no_dupes = people_network.drop_duplicates()
#Which two people are the most connected?
people_network_freq = people_network_no_dupes.groupby(["source", "target"]).size().reset_index(name="freq")
people_network_freq.sort_values('freq',ascending=False).head(10)Now we get a very different list:
There are a lot of pairs of people that worked on two different movies on our list. No two people worked on more than two different movies.
Now we can turn this DF into a graph using NetworkX and run some network analytics. The code below extracts a network from our edge list and sorts by number of degrees per node. For this graph, this means the number of connections each person has.
#Turn df into graph using NetworkX
G = nx.from_pandas_edgelist(people_network_freq, 'source', 'target',edge_attr='freq')
#Find the degree of everyone in the network
G_sorted = pd.DataFrame(sorted(G.degree, key=lambda x: x[1], reverse=True))
G_sorted.columns = ['movie','degree']
G_sorted.head()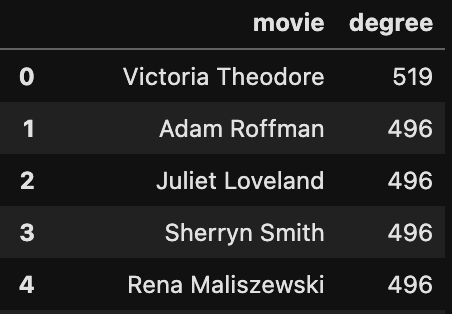
The person with the most connections in our data is Victoria Theodore. She played the role, ‘TTB Band Member #2 — Keyboards’ in ‘Tick, Tick, BOOM!’, and she was a musician on the crew of the movie CODA. Since these two films had two of the three largest cast and crews across all the movies on our list, and Victoria Theodore is the only person who worked on both of them, she has the most connections.
Now that we have a graph, we can run any of the built-in functions on it from NetworkX. Here’s the NetworkX documentation if you want to look around. We can find the total number of people and connections in this network with the following code:
#Number of movies in our network
print(str(G.number_of_nodes()) + " people in the network")
#Number of connections in the network
print(str(G.number_of_edges()) + " connections (movies) in the network")There are 3,414 people in this network and 245,939 connections! This is one of the things that is so cool about networks — while the original dataset may not be huge (we started with 37 movies), network analysis allows us to extract hundreds of thousands of connections and insights that would not be available in standard data analysis.
This wouldn’t be a post about network analysis if we didn’t mention centrality measures. Centrality measures are essentially a way to measure the importance of a node in a network. One way to measure importance is just by counting the number of connections — like we did above with the number of degrees for each node. Another way is to find the betweenness centrality. Here is a description of betweenness centrality from one of my older posts.
“Betweenness centrality is calculated by finding the shortest path between each set of two nodes. For any two nodes, there exists a shortest path between them. The more shortest paths travel through a node, the higher its betweenness centrality. The nodes that act as ‘bridges’ or ‘brokers’ between many nodes or clusters of nodes have higher ‘betweenness centrality’. For example, in an electricity network, where nodes are electrical substations, and links are flows of electricity, a substation that lies on the shortest path between many other substations would have a lot of electricity flowing through it and thus, a higher betweenness centrality.”
We can calculate the betweenness centrality using the following code:
#Calculate bc on our Graph
bc = nx.betweenness_centrality(G,k=1000,weight='freq')
#Get nodes from graph and sort by highest betweenness
bc = pd.DataFrame([bc.keys(), bc.values()]).T
bc.columns= ['names', 'values'] # call them whatever you like
bc = bc.sort_values(by='values', ascending=False)Note that calculating betweenness can take a while.
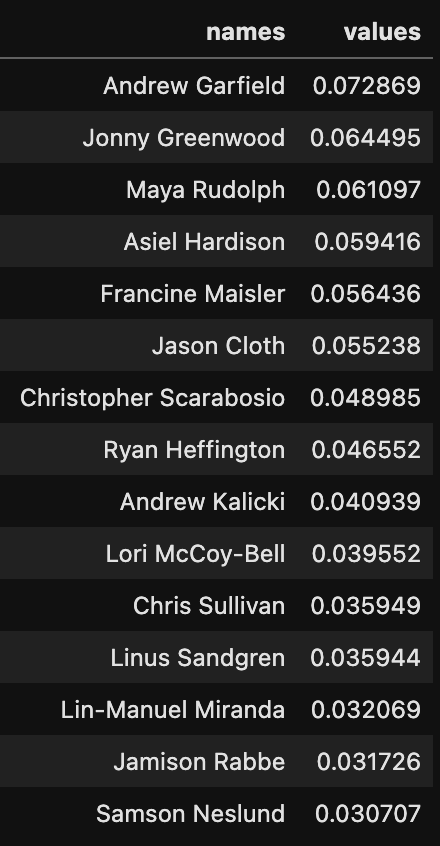
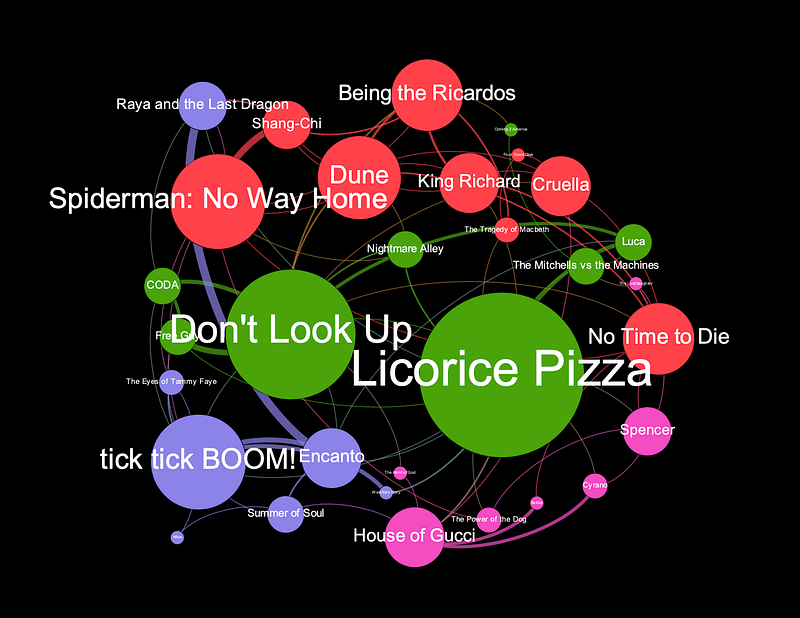
This is the output. As you can see, the person with the highest betweenness centrality in this network is Andrew Garfield — he was in three of these movies. Likewise, Jonny Greenwood did the score for three movies so he has a very high betweenness centrality. Maya Rudolph had a part in Licorice Pizza and was in both Luca and The Mitchells vs The Machines. Asiel Hardison is a dancer who appeared in both ‘Being the Ricardos’ and ‘Coming 2 America.’ Since he is one of only two connections between Coming 2 America and the rest of the movies, he has very high betweenness centrality. The other connection for Coming 2 America is John Legend, who is in the animated movie ‘The Mitchells vs the Machines’ and plays himself in Coming 2 America. If you’d like to see a visual representation of the people with the highest betweenness, here is a graph I made in Gephi.
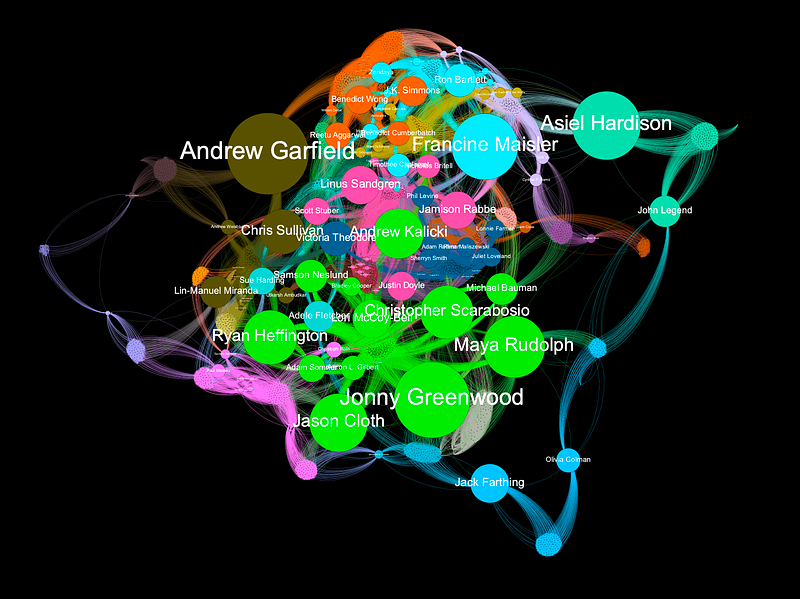
To build this graph in Gephi, you will need to export both an edge list and a node list as csv files and then import them into Gephi. Here is the code to export the two files:
#Get list of nodes from graph
G_nodes = pd.DataFrame(sorted(G.degree, key=lambda x: x[1], reverse=True))
G_nodes.columns = ['names','degree']
#Merge betweenness scores into node list
people_nodes = pd.merge(G_nodes,bc, how='left', left_on="names",right_on="names")
#Rename 'names' column -- Gephi is weird about that
people_nodes = people_nodes.rename(columns={'names': 'Id'})#Export to csvs
people_nodes.to_csv("peopleNodes.csv")
people_network_freq.to_csv("peopleEdges.csv")Conclusion
Benefits of the TMDB database
The TMDB API is a rich resource of movie data. I wrote a post a few years ago using network analysis on movie data with the IMDb database, but there are serious limitations with that data. IMDb only lists 7–10 ‘principals’ for each movie — this is usually the director, a couple producers, the composer, and a few actors. With the TMDB database, we get the full cast and crew for each movie. This allows us to build much larger, more complete, and interesting networks.
The TMDB database is also available through an API. All of the IMDb datasets are static files available here to download. The files are enormous and require a lot of processing and filtering to get to a point where you can easily query them. The benefit of using those large static files however, is that we start with all of our data in one place. If we want a complete list of all movies from the TMDB database we’ll have to run additional queries for lists of movies — I haven’t done that yet.
Thoughts on the movie network
All of the American movies on the list are connected but some international films were disconnected. There were four movies completely disconnected from the graph (‘Parallel Mothers’, ‘Lunana: a Yak in the Classroom’, ‘Drive My Car’, and ‘Writing with Fire’) — all international films. Two nominated international films (‘The Worst Person in the World’ and ‘Flee’) were connected to each other but no other film. ‘The Hand of God’ is an Italian film nominated for best international film, but it is produced by Netflix so shares a producer with ‘Don’t Look Up,’ (also a Netflix film) and has the same art director (Saverio Sammali) as ‘House of Gucci.’
In the post I wrote a few years ago with IMDb data, I ran a community detection algorithm to divide the network into tightly grouped nodes, or communities. The network naturally broke down along geographic lines — there was a Chinese film community, a Spanish community, etc. The nodes that act as bridges between these communities and the central ‘Hollywood’ community had the highest betweenness centrality. For example, Penélope Cruz has high betweenness centrality because she is often the bridge between Hollywood and the Spanish film community. This division along geographic/language lines also seems evident in this 2022 Oscar analysis i.e. international films are less connected.
So how dense in this graph? To ask this another way, are the Oscars an incestuous, nepotistic, self-congratulatory sham? One of the reasons I started this analysis is that it seems like a dense graph. Every Oscar nominated movie I watch I see someone from another Oscar nominated movie — it must be a very small world, right? For example, while ‘French Dispatch’ was not nominated for any Oscar, it had Léa Seydoux, Christoph Waltz and Jeffrey Wright in it — all of these actors were also in No Time to Die. I feel like Timothée Chalamet has been in half the movies I’ve watched recently. Or is it just that there are so many people contributing to each movie that almost any two movies will have someone in common?
For a technical answer, we can calculate the graph density and clustering coefficients of our two networks. Here’s a great definition of graph density from Omar Lizardo and Isaac Jilbert’s book Social Networks: An Introduction.
“The density of a graph is a measure of how many ties between actors exist compared to how many ties between actors are possible.”
Our movie network has a graph density of 0.15 and the people network has a graph density of 0.042. This means about 15 percent of potential connections between the movies exist and only 4 percent of connections between people. Is that high or low? To answer that, we really need something to compare it to. This graph may be more sparsely connected than neural pathways in the brain, but what about compared to other networks of people in film? As a next step, I’d like to compare a network like this to a network of 37 randomly selected movies and see whether the Oscar nominees are more or less closely connected than a random selection of films.
One takeaway from this analysis is that there are more people on the crews that worked on three different Oscar nominated movies than there were actors. Only three actors were in three movies but there were 8 crew members who worked on three movies.
For clustering coefficient, Wikipedia provides this definition:
“In graph theory, a clustering coefficient is a measure of the degree to which nodes in a graph tend to cluster together.”
Our movie graph has a clustering coefficient of 0.3, and the people graph has a clustering coefficient of 0.98. The people network has a much higher clustering coefficient, but that is to be expected given the way we extracted this graph. For each movie, everyone who worked on the movie got a connection to everyone else who worked on the movie. This means we have 37 complete graphs, one for each movie, by definition. Again, it is hard to say whether a clustering coefficient of 0.3 is high or low without something to compare it to.
Some follow up questions I have are: is a 0.3 clustering coefficient high compared to other (non-nominated) films? Are these graph density measures high or low compared to other (non-nominated) films? Do movies cluster based on production company or director or some other variable? Can we measure representation at the Oscars using network analysis i.e. is this selection of 37 films representative of the industry as a whole? Where are the representation gaps? Have the Oscars been increasing the representation of nominees over time? Which pairs of people have been nominated the most over time?
Extracting a graph out of movie data allows us to ask questions we wouldn’t be able to answer through traditional data analysis. Even the simple questions answered in this post like, ‘are there any movies disconnected from the rest of the Oscar noms?’ can only be answered by connecting our data into a graph. Once we have transformed the data into a graph, we can answer many more questions, some of which I’ve listed above. Perhaps most importantly, turning the data into a network provides a much more intuitive sense of the structure of the data and allows us to think differently and more creatively about the questions we may be able to ask.
If you found this tutorial helpful and enjoyable please follow :)
Feel free to comment with any questions and I’ll try to answer.