avatarMathcube

Free AI web copilot to create summaries, insights and extended knowledge, download it at here

2143

Abstract

ass="hljs-keyword">from</span> sympy.abc <span class="hljs-keyword">import</span> x, n

fs = [x**n, sin(x), cos(x), exp(x)]

<span class="hljs-keyword">for</span> f <span class="hljs-keyword">in</span> fs: display(f) integ = integrate(f, x) display(integ)</pre></div><figure id="c72b"><img src="https://cdn-images-1.readmedium.com/v2/resize:fit:800/1*fMW07JTXe1vwRuKLAiLfBg.png"><figcaption></figcaption></figure><p id="c934">If you want to display several items in a row, you can use the <i>ipywidgets</i> package. Simply use <i>pip</i> to install it:</p><div id="0139"><pre>pip install ipywidgets</pre></div><p id="e28d"><i>ipywidgets</i> contains a lot of typical widgets like input boxes, buttons, sliders, color pickers, etc. But the one we will use is the raw <code>Output</code> widget. It is convenient because it allows putting any kind of rich IPython output. <code>Output</code> will serve to display a single cell of our table. The layout of the table is handled by another class from <i>ipywidget</i>: <code>GridspecLayout</code>. Its usage is quite intuitive. Nevertheless, it's practical to wrap it in a function:</p><div id="0a5c"><pre><span class="hljs-keyword">from</span> ipywidgets <span class="hljs-keyword">import</span> GridspecLayout

<span class="hljs-keyword">def</span> <span class="hljs-title function_">display_table</span>(<span class="hljs-params">table_data</span>): <span class="hljs-string">"""Display data in a table layout in Jupyter."""</span>

nrows = <span class="hljs-built_in">len</span>(table_data)
ncols = <span class="hljs-built_in">len</span>(table_data[<span class="hljs-number">0</span>])

grid = GridspecLayout(nrows, ncols)

<span class="hljs-keyword">for</span> row_idx, row_data <span class="hljs-keyword">in</span> <span class="hljs-built_in">enumerate</span>(table_data):
    <span class="hljs-keyword">for</span> col_idx, col <span class="hljs-keyword">in</span> <span class="hljs-built_in">enumerate</span>(row_data):
        out = Output()
        <span class="hljs-keyword">with</span> out:
            display(col)
      

Options

  grid[row_idx, col_idx] = out

display(grid)</pre></div><p id="087b">Using this function, we can gather — row by row — the items we want to display and then call our helper function:</p><div id="b97a"><pre><span class="hljs-keyword">from</span> sympy <span class="hljs-keyword">import</span> *

<span class="hljs-keyword">from</span> sympy.abc <span class="hljs-keyword">import</span> x, n

fs = [x**n, sin(x), cos(x), exp(x)]

rows = [] <span class="hljs-keyword">for</span> f <span class="hljs-keyword">in</span> fs: integ = Integral(f, x) result = integrate(f, x) rows.append([integ, result])

display_table(rows)</pre></div><figure id="8892"><img src="https://cdn-images-1.readmedium.com/v2/resize:fit:800/1*nuM8ZgE0OdcFJ9LLV8M96Q.png"><figcaption></figcaption></figure><p id="9c81">And that’s exactly what we wanted it to look like. The <code>GridspecLayout</code> has a lot of properties and you can adjust its look to whatever you want, as it leverages the full power of CSS. But that's beyond the scope of this little post, which is intended to get you started so that you know what to look for when you want to dig deeper.</p><p id="339e"><i>If you found this article useful, you may want to consider becoming a Medium member to get unlimited access to all Medium articles. By <a href="https://medium.com/@mathcube7/membership">registering using this link</a> you can even support me as a writer.</i></p><p id="559a"><i>More content at <a href="https://plainenglish.io/"><b>PlainEnglish.io</b></a>. Sign up for our <a href="http://newsletter.plainenglish.io/"><b>free weekly newsletter</b></a>. Follow us on <a href="https://twitter.com/inPlainEngHQ"><b>Twitter</b></a></i>, <a href="https://www.linkedin.com/company/inplainenglish/"><b><i>LinkedIn</i></b></a><i>, <a href="https://www.youtube.com/channel/UCtipWUghju290NWcn8jhyAw"><b>YouTube</b></a>, and <a href="https://discord.gg/GtDtUAvyhW"><b>Discord</b></a><b>.</b></i></p><p id="f130"><b><i>Interested in scaling your software startup</i></b><i>? Check out <a href="https://circuit.ooo/?utm=publication-post-cta"><b>Circuit</b></a>.</i></p></article></body>

How to Display Objects in Jupyter in Tabular Layout

Your Daily Dose of Scientific Python

Photo by charlesdeluvio on Unsplash

Jupyter notebooks are a great tool for exploring ideas and for writing scientific or mathematical documents. But there is one thing that annoyed me all the time: there seemed to be no easy way to display objects side by side. Instead, if you display several objects, it will display them vertically one after another. But there is a way to display side by side and this post shows you a way how to do it.

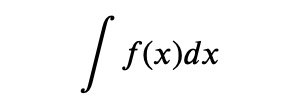
Suppose we want to create a little integral table. The first column shall be the integrand 𝑓(𝑥), the second column shall be the indefinite integral

Using sympy, one would usually start writing something like this, but of course, this will display all results vertically. This is NOT what we want. Look:

from sympy import *
from sympy.abc import x, n

fs = [x**n, sin(x), cos(x), exp(x)]

for f in fs:
    display(f)
    integ = integrate(f, x)
    display(integ)

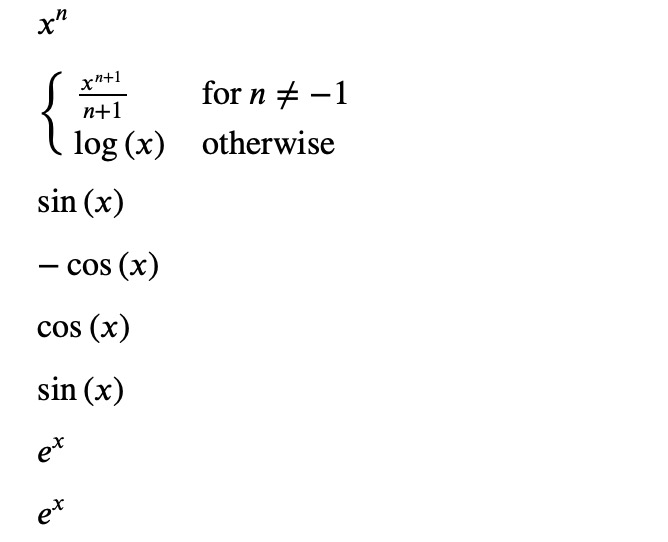
If you want to display several items in a row, you can use the ipywidgets package. Simply use pip to install it:

pip install ipywidgets

ipywidgets contains a lot of typical widgets like input boxes, buttons, sliders, color pickers, etc. But the one we will use is the raw Output widget. It is convenient because it allows putting any kind of rich IPython output. Output will serve to display a single cell of our table. The layout of the table is handled by another class from ipywidget: GridspecLayout. Its usage is quite intuitive. Nevertheless, it's practical to wrap it in a function:

from ipywidgets import GridspecLayout

def display_table(table_data):
    """Display data in a table layout in Jupyter."""
        
    nrows = len(table_data)
    ncols = len(table_data[0])
    
    grid = GridspecLayout(nrows, ncols)

    for row_idx, row_data in enumerate(table_data):
        for col_idx, col in enumerate(row_data):
            out = Output()
            with out:
                display(col)
                grid[row_idx, col_idx] = out

    display(grid)

Using this function, we can gather — row by row — the items we want to display and then call our helper function:

from sympy import *
from sympy.abc import x, n

fs = [x**n, sin(x), cos(x), exp(x)]

rows = []
for f in fs:
    integ = Integral(f, x)
    result = integrate(f, x)
    rows.append([integ, result])

display_table(rows)

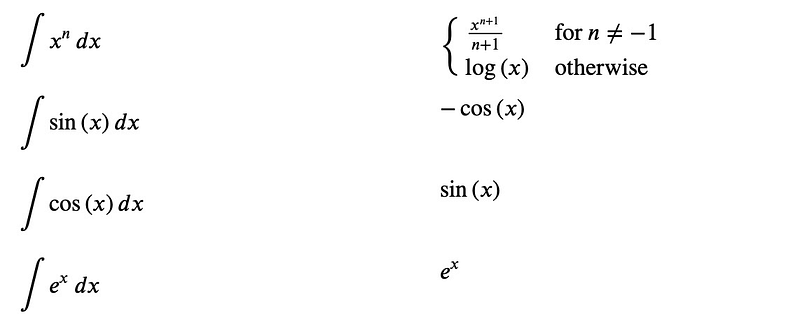
And that’s exactly what we wanted it to look like. The GridspecLayout has a lot of properties and you can adjust its look to whatever you want, as it leverages the full power of CSS. But that's beyond the scope of this little post, which is intended to get you started so that you know what to look for when you want to dig deeper.

If you found this article useful, you may want to consider becoming a Medium member to get unlimited access to all Medium articles. By registering using this link you can even support me as a writer.

More content at PlainEnglish.io. Sign up for our free weekly newsletter. Follow us on Twitter, LinkedIn, YouTube, and Discord.

Interested in scaling your software startup? Check out Circuit.

Python
Jupyter
Science
Data Science
Machine Learning
Recommended from ReadMedium