Free AI web copilot to create summaries, insights and extended knowledge, download it at here
4402
Abstract
lib <span class="hljs-keyword">inline</span></pre></div><div id="952e"><pre><span class="hljs-attribute">epoch</span> = datetime.datetime(<span class="hljs-number">2022</span>, <span class="hljs-number">1</span>, <span class="hljs-number">1</span>, <span class="hljs-number">0</span>, <span class="hljs-number">0</span>, <span class="hljs-number">0</span>).timestamp()</pre></div><div id="47b2"><pre><span class="hljs-comment"># BITCOIN over USD</span>
<span class="hljs-attr">pair</span> = <span class="hljs-string">'XXBTZUSD'</span></pre></div><div id="1d78"><pre>url = f<span class="hljs-string">'https://api.kraken.com/0/public/OHLC?pair={pair}&since={epoch}&interval=1440'</span><span class="hljs-selector-class">.format</span>(pair,epoch)
resp = requests<span class="hljs-selector-class">.get</span>(url)
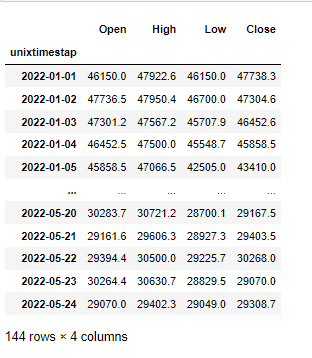
df = pd<span class="hljs-selector-class">.DataFrame</span>(resp<span class="hljs-selector-class">.json</span>()<span class="hljs-selector-attr">[<span class="hljs-string">'result'</span>]</span><span class="hljs-selector-attr">[pair]</span>)
df<span class="hljs-selector-class">.columns</span> = <span class="hljs-selector-attr">[<span class="hljs-string">'unixtimestap'</span>, <span class="hljs-string">'Open'</span>, <span class="hljs-string">'High'</span>, <span class="hljs-string">'Low'</span>, <span class="hljs-string">'Close'</span>, <span class="hljs-string">'vwap'</span>, <span class="hljs-string">'volume'</span>, <span class="hljs-string">'count'</span>]</span>
df<span class="hljs-selector-attr">[<span class="hljs-string">'unixtimestap'</span>]</span> = pd<span class="hljs-selector-class">.to_datetime</span>(df<span class="hljs-selector-attr">[<span class="hljs-string">'unixtimestap'</span>]</span>, unit=<span class="hljs-string">'s'</span>)
df<span class="hljs-selector-class">.set_index</span>(<span class="hljs-string">'unixtimestap'</span>, inplace=True)
df = df<span class="hljs-selector-attr">[[<span class="hljs-string">'Open'</span>, <span class="hljs-string">'High'</span>, <span class="hljs-string">'Low'</span>, <span class="hljs-string">'Close'</span>]</span>]
df<span class="hljs-selector-attr">[<span class="hljs-string">'Open'</span>]</span> = df<span class="hljs-selector-attr">[<span class="hljs-string">'Open'</span>]</span><span class="hljs-selector-class">.astype</span>(<span class="hljs-string">'float'</span>)
df<span class="hljs-selector-attr">[<span class="hljs-string">'High'</span>]</span> = df<span class="hljs-selector-attr">[<span class="hljs-string">'High'</span>]</span><span class="hljs-selector-class">.astype</span>(<span class="hljs-string">'float'</span>)
df<span class="hljs-selector-attr">[<span class="hljs-string">'Low'</span>]</span> = df<span class="hljs-selector-attr">[<span class="hljs-string">'Low'</span>]</span><span class="hljs-selector-class">.astype</span>(<span class="hljs-string">'float'</span>)
df<span class="hljs-selector-attr">[<span class="hljs-string">'Close'</span>]</span> = df<span class="hljs-selector-attr">[<span class="hljs-string">'Close'</span>]</span><span class="hljs-selector-class">.astype</span>(<span class="hljs-string">'float'</span>)
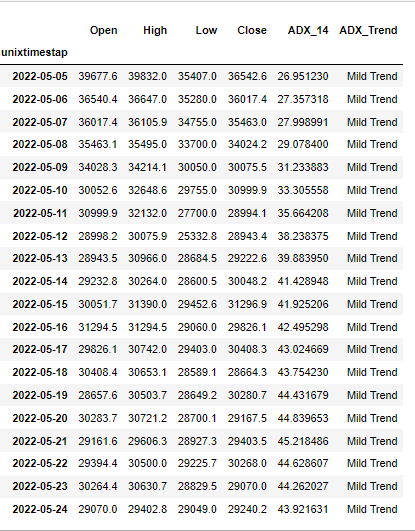
df</pre></div><figure id="cf24"><img src="https://cdn-images-1.readmedium.com/v2/resize:fit:800/0*u3qZXY7K_1jEw6Nk.png"><figcaption></figcaption></figure><p id="028e">Let’s get the ADX with a rolling window of a 14-day period using the <a href="https://mrjbq7.github.io/ta-lib/doc_index.html">talib Python library.</a></p><div id="8c9f"><pre># Calculate the ADX <span class="hljs-keyword">with</span> the <span class="hljs-keyword">default</span> <span class="hljs-type">time</span> <span class="hljs-keyword">period</span></pre></div><div id="9b2f"><pre>df<span class="hljs-selector-attr">[<span class="hljs-string">'ADX_14'</span>]</span> = talib<span class="hljs-selector-class">.ADX</span>(df<span class="hljs-selector-attr">[<span class="hljs-string">'High'</span>]</span>, df<span class="hljs-selector-attr">[<span class="hljs-string">'Low'</span>]</span>, df<span class="hljs-selector-attr">[<span class="hljs-string">'Close'</span>]</span>, timeperiod=<span class="hljs-number">14</span>)</pre></div><p id="4f29">Let’s build a function that returns:</p><ul><li><b>“No Trend</b>” when <b>ADX<=25</b></li><li><b>“Mild Trend</b>” when <b>25<ADX<=50</b></li><li><b>“Strong Trend</b>” when <b>ADX>50</b></li></ul><div id="ad95"><pre><s
Options
pan class="hljs-keyword">def</span> <span class="hljs-title function_">adx_trend</span>(<span class="hljs-params">x</span>):
<span class="hljs-keyword">if</span> x<=<span class="hljs-number">25</span>:
<span class="hljs-keyword">return</span> <span class="hljs-string">"No Trend"</span>
<span class="hljs-keyword">if</span> x><span class="hljs-number">50</span>:
<span class="hljs-keyword">return</span> <span class="hljs-string">"Strong Trend"</span>
<span class="hljs-keyword">if</span> x><span class="hljs-number">25</span>:
<span class="hljs-keyword">return</span> <span class="hljs-string">"Mild Trend"</span>
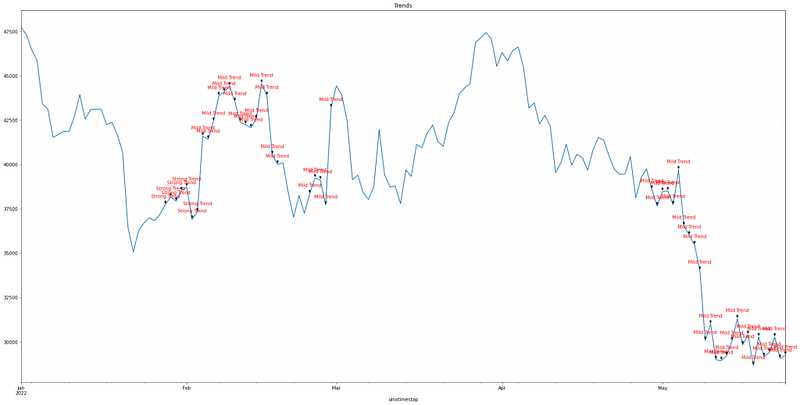
df[<span class="hljs-string">'ADX_Trend'</span>] = df[<span class="hljs-string">'ADX_14'</span>].apply(<span class="hljs-built_in">lambda</span> <span class="hljs-symbol">x:</span>adx_trend(x))</pre></div><div id="e7c9"><pre><span class="hljs-attribute">df</span>.tail(<span class="hljs-number">20</span>)</pre></div><figure id="d519"><img src="https://cdn-images-1.readmedium.com/v2/resize:fit:800/0*k2ADjDQwkUTzHgxd.png"><figcaption></figcaption></figure><p id="6407">As we can see, during this time period (i.e. the last 20 days) there is a moderate trend in the market. Let’s have a look at the graph of the closing prices of Bitcoin, annotating the labels of the trend when there is a mild or strong trend.</p><div id="40ac"><pre><span class="hljs-attribute">ax</span> = df.Close.plot(figsize=(<span class="hljs-number">30</span>,<span class="hljs-number">15</span>), title= <span class="hljs-string">"Trends"</span>)</pre></div><div id="545f"><pre><span class="hljs-keyword">for</span> <span class="hljs-selector-tag">i</span> <span class="hljs-keyword">in</span> <span class="hljs-built_in">range</span>(df<span class="hljs-selector-class">.shape</span><span class="hljs-selector-attr">[0]</span>):
<span class="hljs-selector-tag">label</span> = df<span class="hljs-selector-class">.ADX_Trend</span><span class="hljs-selector-attr">[i]</span>
<span class="hljs-keyword">if</span> label==<span class="hljs-string">'Strong Trend'</span> or label==<span class="hljs-string">'Mild Trend'</span>:
ax<span class="hljs-selector-class">.annotate</span>(<span class="hljs-selector-tag">label</span>,
(df<span class="hljs-selector-class">.index</span><span class="hljs-selector-attr">[i]</span>, df<span class="hljs-selector-attr">[<span class="hljs-string">'Close'</span>]</span><span class="hljs-selector-attr">[i]</span>),
xytext=(<span class="hljs-number">0</span>, <span class="hljs-number">15</span>),
textcoords=<span class="hljs-string">'offset points'</span>,
arrowprops=<span class="hljs-built_in">dict</span>(arrowstyle=<span class="hljs-string">'-|>'</span>), <span class="hljs-attribute">color</span>=<span class="hljs-string">'r'</span>, ha=<span class="hljs-string">'center'</span>)</pre></div><figure id="7995"><img src="https://cdn-images-1.readmedium.com/v2/resize:fit:800/0*D2puO6WX2lZZOEx0.png"><figcaption></figcaption></figure><h1 id="eb3a">Related Articles</h1><ul><li><a href="https://predictivehacks.com/how-to-apply-an-rsi-trading-strategy-to-your-cryptos/">How to Apply an RSI Trading Strategy to your Cryptos</a></li><li><a href="https://predictivehacks.com/how-to-apply-an-rsi-trading-strategy-to-your-cryptos/">How to get the ROI of your Cryptocurrencies with Kraken API</a></li><li><a href="https://predictivehacks.com/how-to-apply-an-rsi-trading-strategy-to-your-cryptos/">Get the Portfolio Balance with Kraken API</a></li><li><a href="https://predictivehacks.com/how-to-apply-an-rsi-trading-strategy-to-your-cryptos/">Cryptocurrency Portfolio Optimization in Python</a></li><li><a href="https://predictivehacks.com/how-to-apply-an-rsi-trading-strategy-to-your-cryptos/">How to get the most and least Volatile Cryptocurrencies</a></li><li><a href="https://predictivehacks.com/how-to-apply-an-rsi-trading-strategy-to-your-cryptos/">How to Get Cryptocurrency Data from Kraken API in Python</a></li><li><a href="https://predictivehacks.com/how-to-apply-an-rsi-trading-strategy-to-your-cryptos/">Retweet Network Analysis in Cryptocurrencies</a></li></ul><p id="92d5">Originally posted by <a href="https://predictivehacks.com/how-to-detect-trends-in-cryptocurrencies-with-adx-using-kraken-api/">Predictive Hacks</a></p></article></body>