
TUTORIAL — PYTHON — PYECHARTS
How to Create Web-Friendly Charts with Apache ECharts and Python
A step-by-step tutorial on using PYECHARTS to create Apache ECharts with Python and JavaScript

Introduction
Hi, I am Gregor, a consultant and technical nerd who is very much interested in data visualization and data science. I am always looking for new and quicker ways to show information hidden in data. I often handle data with Python (Pandas) or R (Tidyverse).
Usually, the result of such an exercise is plots saved as images that end up in a PowerPoint document presented to clients. Since these are static images, additional information is provided as text as part of the PowerPoint document.
Recently I discovered Apache ECharts, an open-source tool to visualize data on the web using JavaScript. Using Apache ECharts instead of Python’s matplotlib gives you these benefits:
- Built-in interactions and automatically generated chart description
- Web-Friendly, i.e., works on desktop and mobile
- Elegant out of the box

Since Apache ECharts would require me to program JavaScript, I looked into available Python APIs. pyecharts is a Python API to create necessary HTML and JavaScript code using Python.
This article will introduce you to Apache ECharts and pyecharts, a Python library to create Apache ECharts. I will also show you how to set up your setup and walk you through two examples.
Apache Echarts & PYECHARTS
Apache ECharts
Apache EChartsTM is an open-sourced JavaScript visualization tool which can run fluently on PC and mobile devices. It is compatible with most modern Web Browsers, e.g., IE9/10/11, Chrome, Firefox, Safari and so on.

In other words, you can program your data visualizations using JavaScript directly on your HTML pages. Apache ECharts provides the necessary library so that any visitor’s browser to your website can render the visualization. The result is a dynamic and interactive graph (cf. video above).
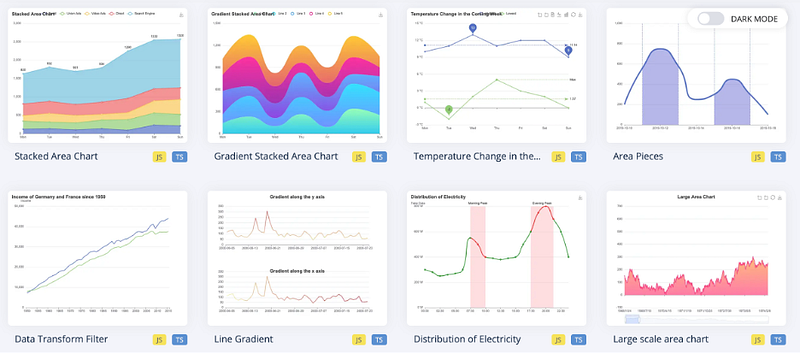
Apache ECharts offers commonly-used chart types as a data visualization library, including line graphs, bar charts, maps, and treemaps.
pyecharts
Programming with JavaScript might scare you if you are accustomed to creating your visualization programmatically with R, Python, or Julia. Pyecharts is a Python library that allows you to create Apache EChart-compatible JavaScript files for your data visualization. This saves you from learning JavaScript and staying in your programming environment. Next to pyecharts, there are wrappers available for R and Julia.
Setup
Before we get started, you need to install pyecharts using pip.
pip install pyecharts
For this tutorial, I also make use of the beautiful Gapminder dataset. Gapminder’s data is released under the Creative Commons Attribution 3.0 Unported license. I kindly refer to these articles to learn more about it: 7 Data Wrangling Python Functions in under 5 Minutes and How to use Color Palettes for your Data Visualization.
Tutorial
Next, we need to import the necessary libraries.
In the following sections, I create two different plots with pyechart: Barplot and Boxplot.
Barplot
For the Barplot, I group the Gapminder data by continent using pandas. If you wonder how I structure my code, it is called method chaining or piping (in the R community). I explain the basics in one of my other articles.
Finally, let us create a basic bar plot using the created dataset. We start by calling the Bar function. I passed some options into the Bar function, such as width and height. add_xaxis and add_yaxis receive the necessary data columns for the x- and y-axis. In this case, I pass the continent information on the x-axis and the average population on the y-axis. Set_global_options sets the title and subtitle for this graph. set_series_opts allows adding additional information. I add marks for the minimum and maximum average population in this case. Finally, render() renders the necessary JavaScript and a corresponding HTML file gracefully. If you are using a Jupyter Notebook or Lab, please use the function render_notebook(). This will render the plot directly within your notebook.
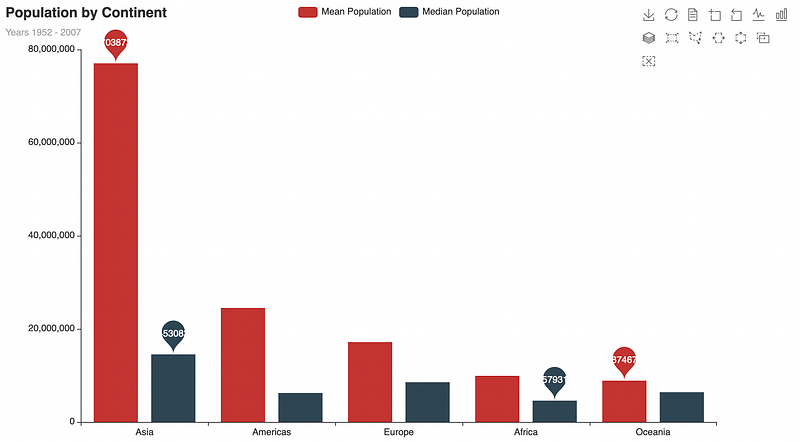
Please note that it is impossible to pass a pandas series directly to pyecharts. Instead, you need to transform the series into a list. This does the trick for me. Please reach out to me if you know how to do it differently.
Boxplot
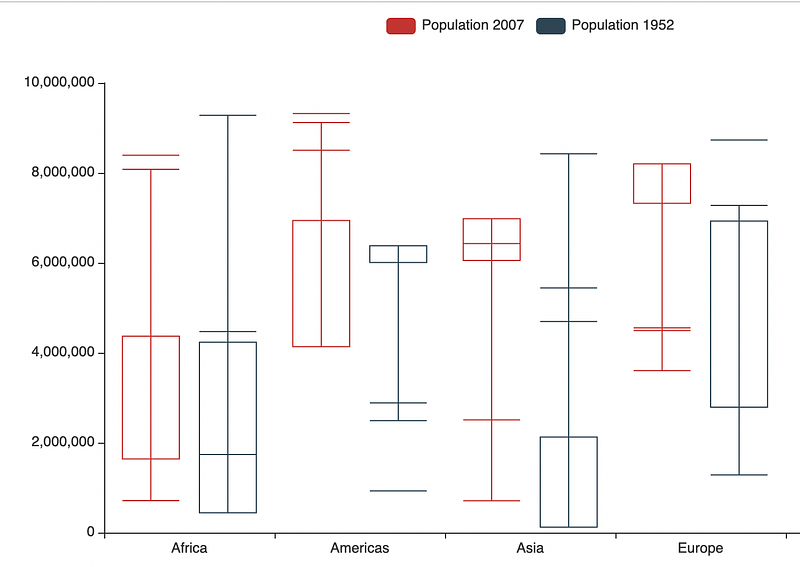
For the Boxplot, I would like to compare population by continent for the years 1952 and 2007. Firstly, I create a list that contains all five continents. This will serve as the x-axis and create lists containing populations for 1952 and 2007.
After creating all lists, I use the Boxplot() function to initialize the plot. Using add_xaxis, I pass the continent list. Following that, I use add_yaxis twice for each population list.
Conclusion
This article introduces you to Apache ECharts and pyecharts, a Python library to create Apache ECharts. I also showed you how to set up your setup and walked you through two examples. Please note that I could only scratch the surface. There are so many more possibilities with Apache ECharts as well as pyecharts. But this article can get you started.
Apache ECharts is a powerful data visualization library. It is aimed at creating and publishing interactive charts on the web. pyecharts helps Python developers create ECharts plots within their favorite programming language, which also increases development speed. However, I find pyecharts not as perfect as I would like it to be, especially in comparison to ggplot2 or Altair. With pyecharts, you need to work with lists instead of pandas series. It also requires you to slice data sets to create more than one series per chart. On top of that, I found that the documentation is slightly out of date, which holds me back from testing out more. What do you think?
If you would like to read more about my journey, please consider following me, or if you are not a medium member, please consider joining here. Very much appreciated.
Thank you, Gregor


