
How to Create Interactive Maps with Python Using OpenStreetMap and Plotly

Have you ever wondered how to create an interactive map with custom data points, roads, and features? Imagine a map where you can zoom in, view detailed information, and visualize data dynamically. Today, we’ll dive into a recipe that makes this possible using Python, OpenStreetMap, and Plotly. By the end of this guide, you’ll have a stunning, interactive map at your fingertips!
Introduction
In this tutorial, we will explore how to combine the power of OpenStreetMap and Plotly to create engaging and interactive maps. We’ll use a sample dataset to plot car share data in Montreal, but you can easily adapt the recipe to use your own data.
What You’ll Need
- Basic knowledge of Python
- Familiarity with an IDE like Visual Studio Code
- Installed libraries:
plotlyandpandas
Step-by-Step Guide
Step 1: Set Up Your Environment
First, ensure you have the required libraries installed. You can install them using pip:
pip install plotly pandas
Step 2: Create Your Python Script
Open Visual Studio Code and create a new Python file, for example, interactive_map.py. Copy the following code into your script:
import plotly.express as px
import pandas as pd

# Load the car share dataset
df = px.data.carshare()
print(df.head())

# Create the scatter map box
fig = px.scatter_mapbox(
    df,
    lat="centroid_lat",
    lon="centroid_lon",
    color="peak_hour",
    size="car_hours",
    color_continuous_scale=px.colors.cyclical.IceFire,
    size_max=15,
    zoom=10,
    mapbox_style="open-street-map"
)

# Update the layout with a title and margins
fig.update_layout(
    title="Montreal Car Share Data",
    margin={"r":0,"t":0,"l":0,"b":0},
    height=600,
    width=800
)

# Show the map
fig.show()
3. Summary of the Code
This Python script leverages Plotly and OpenStreetMap to create an interactive map that visualizes car share data in Montreal. Here’s a brief explanation of the key components:
- Import Libraries: The script begins by importing the necessary libraries:
plotly.expressfor creating the map andpandasfor handling the dataset.
import plotly.express as px
import pandas as pd
2. Load the data
df = px.data.carshare()
print(df.head())
3. Create the Map: Using the scatter_mapbox function from Plotly, the script creates a scatter plot on an interactive map. It sets the latitude and longitude for plotting points, colors the points based on peak hours, and sizes them based on car hours. The map style is set to OpenStreetMap.
4. Customize the Map Layout: The script updates the map layout to include a title and adjusts the margins for better visual presentation.
fig.update_layout(
    title="Montreal Car Share Data", # Add a title to the map
    margin={"r":0,"t":0,"l":0,"b":0}, # Adjust the margins of the map
    height=600,
    width=800
)
5. Display the Map: Finally, the script renders the map in a web browser, allowing for interactive exploration of the data points.
fig.show() # Display the map in a web browserResults
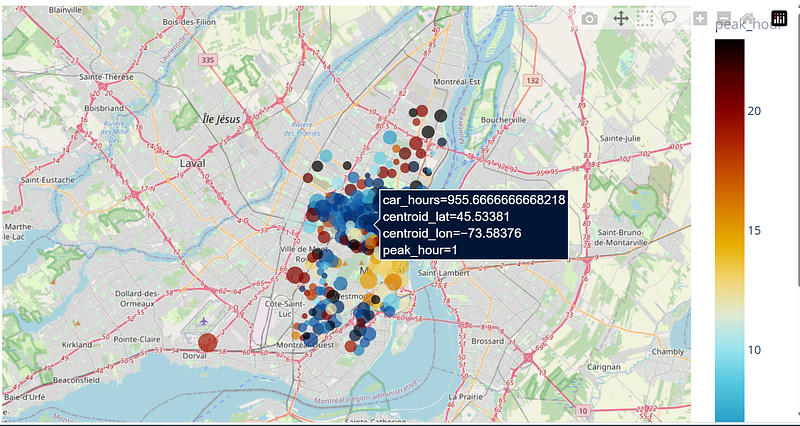
You can easily play with the maps using

you can zoom out/in, take screenshots, select specific zones
Conclusion
With just a few lines of code, you can create a fully interactive map using Python, Plotly, and OpenStreetMap. This recipe demonstrates the power of combining these tools to visualize geographical data dynamically and engagingly. Whether you’re analyzing traffic patterns, visualizing location-based services, or simply exploring data, this approach provides a solid foundation.
Follow me on Linkedin https://www.linkedin.com/in/kevin-meneses-897a28127/ and Medium https://medium.com/@kevinmenesesgonzalez/subscribe Subscribe to the Data Pulse Newsletter https://www.linkedin.com/newsletters/datapulse-python-finance-7208914833608478720


