
How to Create a GIF from Matplotlib Plots in Python
A data visualization technique for 2-dimensional time series data using imageio
We all know that line plots are the most intuitive way to visualize a time series. But how would you visualize a time series with two features that have a relationship, like x and y coordinates or longitude and latitude? GIFs are a great way to visualize 2-dimensional time series data.
GIFs are a great way to visualize 2-dimensional time series data.
Let’s have a look at the following example.
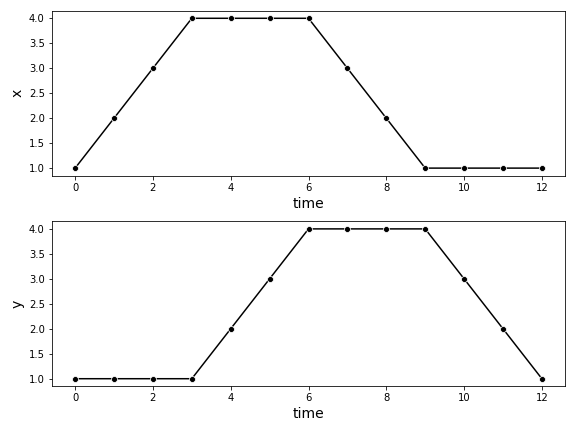
x = [1, 2, 3, 4, 4, 4, 4, 3, 2, 1, 1, 1, 1]
y = [1, 1, 1, 1, 2, 3, 4, 4, 4, 4, 3, 2, 1]
time = [0, 1, 2, 3, 4, 5, 6, 7, 8, 9, 10, 11, 12
You can first plot each feature over the time with a line plot. But with this data visualization, the relationship between the two features is unclear.
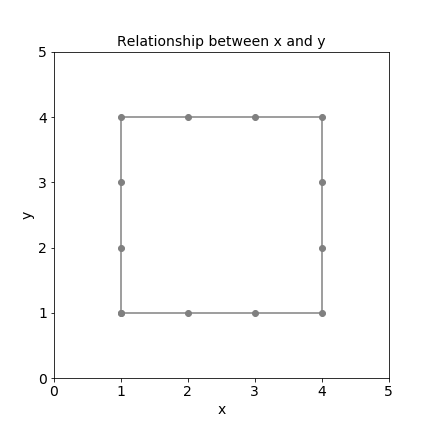
Next, you can plot x over y, which reveals the relationship between the two features. But now you are missing the time aspect.
To visualize the relationship between the two features and the time, we can use a GIF.
This tutorial will show you how to quickly create a GIF in Python with three simple steps.
How to Create a GIF in Python
You can create a GIF in Python in just three simple steps using the libraries Matplotlib and imageio:
- Create a Function to Plot Time-Dependent Frames with Matplotlib
- Plot All the Frames of the GIF
- Combine the Frames Into a GIF with imageio
For this tutorial, we will use Matplotlib to plot the single frames of the GIF and imageio to combine the single frames into one GIF.
import matplotlib.pyplot as plt
import imageio
1. Create a Function to Plot Time-Dependent Frames
First, you will create a function create_frame(t) that plots a single frame of the GIF at one specific timestamp and saves it with a unique name.
I recommend setting the parameters transparent = False and facecolor = 'white' to avoid getting strange-looking effects in your GIFs due to overlapping single transparent frames.
def create_frame(t):
fig = plt.figure(figsize=(6, 6)) plt.plot(x[:(t+1)], y[:(t+1)], color = 'grey' )
plt.plot(x[t], y[t], color = 'black', marker = 'o' ) plt.xlim([0,5])
plt.xlabel('x', fontsize = 14)
plt.ylim([0,5])
plt.ylabel('y', fontsize = 14)
plt.title(f'Relationship between x and y at step {t}',
fontsize=14) plt.savefig(f'./img/img_{t}.png',
transparent = False,
facecolor = 'white'
) plt.close()2. Plot All the Frames of the GIF
Next, all you have to do is to plot all the frames of the GIF.
for t in time:
    create_frame(t)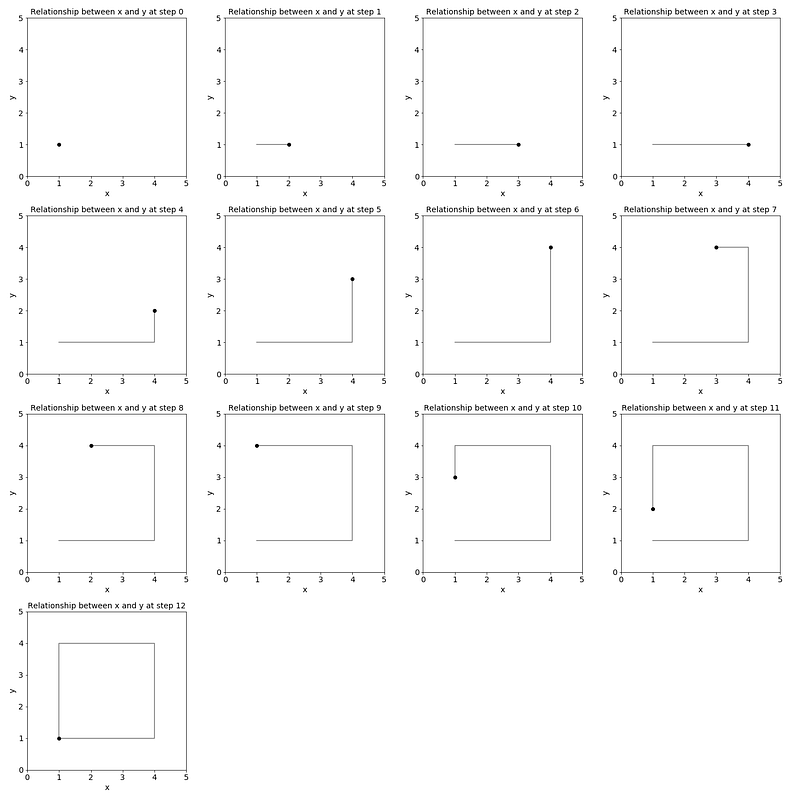
And save all of the single frames into an array called frames.
frames = []for t in time:
image = imageio.v2.imread(f'./img/img_{t}.png')
frames.append(image)3. Combine the Frames Into a GIF
Finally, all you have to do is save the frames to a GIF with the mimsave method. You can adjust the GIF’s frames per second (fps) with the fps parameter.
imageio.mimsave('./example.gif', # output gif
                frames,          # array of input frames
                fps = 5)         # optional: frames per second
The resulting GIF is shown below.
If you want the GIF to stop after the last frame, add the parameter loop = 1 to the mimsave method.
imageio.mimsave('./example.gif',
                frames,
                fps = 5,
                loop = 1)
Conclusion
Visualizing 2-dimensional time series data with line plots can be ineffective because it does not show the relationship between the two features. Using GIFs is a better data visualization alternative for 2-dimension time series data like longitude and latitude or x and y coordinates.
In this brief tutorial, you learned how you can create a GIF with Matplotlib and imageio in Python in just three simple steps:
- Create a Function to Plot Time-Dependent Frames with Matplotlib
- Plot All the Frames of the GIF
- Combine the Frames Into a GIF with imageio
Enjoyed This Story?
Here is a collection of my other Time Series Analysis and Forecasting articles:
Subscribe for free to get notified when I publish a new story.


