
How to create a custom Dataset / Loader in PyTorch, from Scratch, for multi-band Satellite Images Dataset from Kaggle
Update
For information about the course Introduction to Python for Scientists (available on YouTube) and other articles like this, please visit my website cordmaur.carrd.co.
Introduction
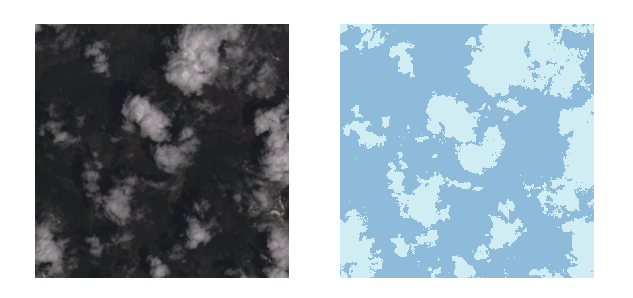
In my last Medium story (here) I proposed an approach using the high level API Fast.ai to detect cloud contours in satellite images. Detecting object contours (i.e. all the pixels belonging to the same object) is called semantic segmentation. The dataset that was used for the task is the 38-Cloud: Cloud Segmentation in Satellite Image, from Kaggle.
Although we could achieve a relatively good accuracy of 96% with a few lines of code, the model was not able to consider all the input channels, Red, Green, Blue and NIR(Near Infrared) provided in the dataset. The problem is that most of the semantic segmentation models found in deep learning frameworks like Keras, Fast.ai and even PyTorch are designed to, and come with pre-trained weights, to work with RGB images. Besides that, the vision module of these libraries are also stuck to RGB files. That is the reason we ignored the NIR channel in the previous story and used only RGB patches.
This pushed me to go for a completely different approach here… build my own U-Net (very simple one) from the scratch and not using the vision libraries for preparing the dataset. As a start, this story I will show how to create the dataset using plain PyTorch functions and the next one Creating a Very Simple U-Net Model with PyTorch for Semantic Segmentation of Satellite Images is a continuation that explains how to create a simple segmentation model and train it to achieve great results. Let’s go.
Data Preparation
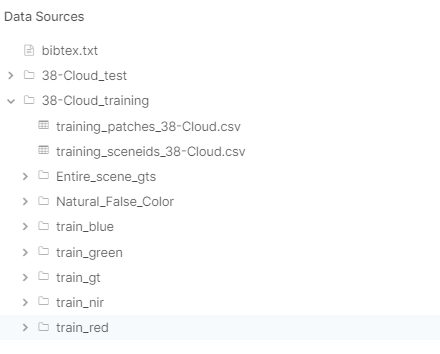
As I already explained in the last article, this dataset is composed of 8400 training patches of size 384x384 (suitable for deep learning purposes). Another set of 9201 patches is left for testing, but we are not dealing with them for now. The patches are separated in directories for the Red, Green, Blue and NIR (Near Infrared) channels and there is an additional directory for the reference mask (ground truth — *_gt). The structure is shown in Figure 1.
Instead of downloading the whole dataset to your computer (which takes a lot of space), it is possible to create a notebook directly in Kaggle. I published a Kaggle notebook (here) with all the necessary code.
The PyTorch Dataset class
In the last article we created the rgb_patch*.tif files in disk, using PIL to combine the bands into 384x`384x3 png files. With the files on disk, we then created the dataset using fastai.vision’s ImageDataBunch.from_folder function.
Instead of using torchvision to read the files, I decided to create my own dataset class, that reads the Red, Green, Blue and Nir patches and stack them all into a tensor. In order to do that, we need to create a custom PyTorch’s Dataset. To do that, we have to inherit a new class from torch.utils.data.Dataset class. Our new dataset class needs to basically do the following:
- map the files available in the dataset and return the number of items through the
__len__()function, - combine all the 4 channels into a single tensor, without the need to save it to disk, and
- for a given index, return a tuple (x, y) with a sample from the dataset where x is the 4 channels tensor and y is the ground truth mask. For that, we should define the
__getitem__()function.
Our class will receive as input the directories of each channel and start by mapping the files and combining into a dictionary the paths for all the bands.
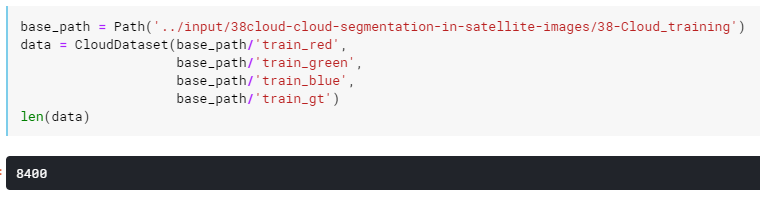
Creating this dataset as data in the Kaggle should give us the following result:
After that, we need a function to open the patches and combine them into a single array, given an index. In this function we have to note three important things:
- as we want the possibility to check visually the combined images into the notebook, we added an option to exclude the NIR (
include_nirflag) band and return just RGB, - for PyTorch, the channels axis should not appear in the last dimension. So, instead of 384x384x4 we should return 4x384x384. As we will need to visualize the images we will use the
invertflag to do this whenever we want, and - we normalize the data into 0–1 scale.
Next step is to define a function to open the the mask for a specific index and the __getitem__() function to return the (x, y) tuple.
For the open_mask function, we will additionally change the ground truth values from 0 and 255 to 0 and 1 to fit correctly in the deep learning model.
Finally, we will add a open_as_pil function to return the PIL image and we can also override the __repr__() function to get an additional representation of the dataset.
We finished the dataset class. We can check it’s functionality indexing it (returns in PyTorch style) or calling open_as_array directly to display the results with matplotlib, for example.
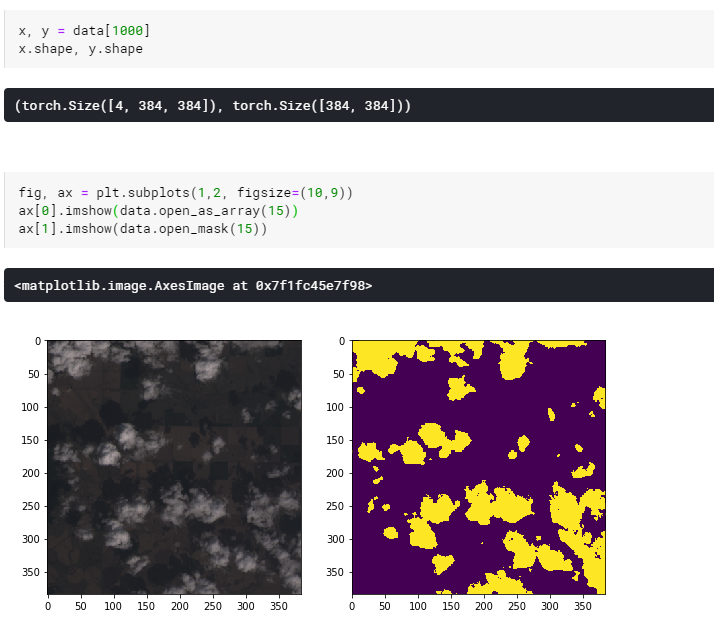
It seems that our dataset is ok. Now split it into train and validation sets and create a dataloader.
The Dataloader class
The dataloader is responsible for preparing the batches (group of samples) to pass them to the model. Splitting the dataset into training and validation set and put it into a prepare a dataloader is rather simple as PyTorch provide the utils to do this.
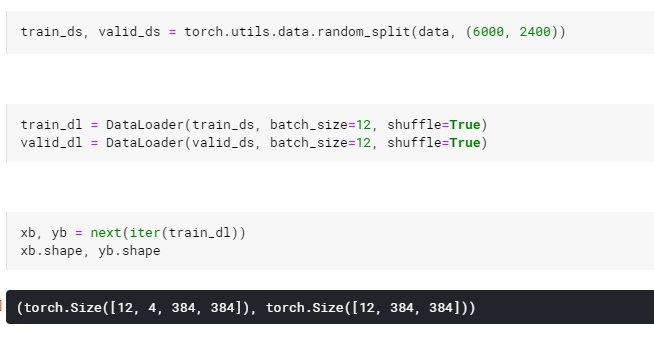
Note that PyTorch creates a new dimension at the beginning to group the samples of the batch.
Conclusion
As you can see, creating a custom dataset for images in PyTorch is not as difficult as it can appear on a first glance. Sometimes we are used to employ the libraries available, but they don’t fit all purposes and we now have a fully customizable dataset to work on multidimensional images.
If you have any doubt don’t hesitate to contact me and don’t forget to access the notebook on Kaggle (notebook here) . On the next story Creating a Very Simple U-Net Model with PyTorch for Semantic Segmentation of Satellite Images we will create a deep learning segmentation model to solve this dataset with great results. See you on the next story.


