
How to collect market data completely free and organize in MongoDB for your Algo trading side hustle
Week 4
I have to say that collecting historical market data is a major pain point for a nonprofessional trader who does not want to pay $$ to various data providers. It is easy for me to get nostalgic about good ole’ days when I used the Bloomberg excel plugin =BDH(…) and voila! Or fetching them from Onetick in C++.
But the knowledge I have to impart today is a completely FREE framework for collecting essential market data and storing them in a database. We won’t have the hedgefund-level augmented data like how many ships are stuck queuing outside of San Pedro Bay, but we will have correlated data points to those such as intraday coal & natural gas prices. I am recommending this framework especially for for aspiring traders who are still refining a working Algo strategy. If you already have a profitable algo strategy that can work consistently in today’s trading climate then perhaps pay for collocated server (e.g. QuantConnect) and capitalize on it ASAP. This completely free framework is for back testing new algo ideas until you have the consistent profits to pay for the bells and whistles (e.g. cloud computing, collocation, GPUs).
Sometimes you don’t need advanced data analysis to trade profitably. The mean-reversion strategies I introduced last week can operate in the absence of most of the data we’ll collect today; nevertheless, having a lot of data could be useful in determining the likelihood that a particular mean-reversion pattern might be coming to an end soon.
How to collect market data?
Market data is needed for backtesting new algo ideas; unfortunately, most free data providers give between 30 to 60 days worth of intraday data. In fact, they are all pretty consistent in the policy of providing 1 minute granularity data for 30 days and 5minute granularity data for 60 days. The only difference amongst them is what data columns they provide. As a serious nonprofessional trader, you will have to save any relevant data into a database every 30 days. Because after the 30 days, they become unavailable. Even finer granularity data is available via streaming API from TDAmeritrade. As I mentioned in my Week 1 article, one can even get level II market data (i.e., the whole ladder) from TDAmeritrade streaming API. Level II data is beyond the scope of this week’s blog post as I wanted to properly address it with the finance introduction+ python code the whole package. The good news is that there is still a lot one can do with 5 minute granularity data.
What data to collect?
The definition of essential market data is changing day by day. In Week 1 of this blog series, I had talked about collecting major index futures, interest rate related assets (TLT, TIPS) and some commodity prices. Under normal circumstances, those inputs are sufficient for passable price prediction models (e.g. momentum-based indicator); however, the U.S. markets has gotten more interesting over the past month. Now in week 4, I realize that my own dataset would have to be greatly expanded. For example, just last week, cotton prices rose to 10 year highs, a few months ago natural gas prices have reached multi-year highs, and a few days ago both coal and oil prices climbed to 7 year highs. The dollar index is also breaking out, which is doubly interesting since dollar and oil tend to move to opposite directions and now the usual negative correlation has broken down.
When market conditions change, the kind of data we need to collect also changes. For example, I have not paid attention to oil prices nor the oil industry for many years, but now that inflation becomes a more important factor to asset prices, we have no choice but to include them. Here is why:
As a rule of thumb, if inflation rises above 4%, that will start to hurt U.S. GDP growth (i.e. stagflation). According James Bullard in a recent interview, U.S. core inflation is at 3.5% already, this means we only need 0.5% extra inflation push the economic regime over the edge. Hence even though tracking a multitude of commodity prices seem like small potatoes, they do add up when all combined together.
Now the code for TDAmeritrade data source
I’ve used the TDAmeritrade API in previous week’s blog to get historical data; I share the code on gist below. The query2day function takes a start date in the day_str parameter and the stock symbol in the ticker parameter.
Theoretically, one should be able to fetch 1 minute granularity futures data using the same API; however, I’m stuck on how to handle the forward slash in all the futures symbol tickers (e.g. /ESZ21 ) as the urlencode conversion seems to be the wrong way to pass it in. If anyone has figured this out already, please share findings in comments.
One reason I haven’t found the solution to forward-slash-TD-API problem is that I have a workaround using another free data source.
The yfinance source
Remember I had mentioned yahoo finance discontinued its API a few years ago and that was a really sad day for all at-home nonprofessional algo traders? Well, the author of the yfinance package seems to have found a way to fix it, at least that’s what I read in the package description
The yfinance package can fetch everything the price history endpoint of the TDAmeritrade API can, and more! You can also fetch intraday data on foreign stock indices, foreign individual stocks, currency, and even bitcoin prices. The symbol tickers you would use for yahoo finance is a lot different than anywhere else.
Now the code for yfinance data source
You can specify the symbols you want to fetch by creating a python file called ticker_symbols.py in the style of this file, and then run the code in the below gist in the same directory. One advantage of using MongoDB is that it can handle collection names with special characters such as ES=F or ^FVX.
Please note that for foreign stock market data, my code keeps datetime as local time. This is intentional as I don’t want to deal with daylight savings etc. For example, the Samsung stock data in a trading day will start at 9am and end at 3:30pm (as yfinance doesn’t fetch the premarket for any of the Asian markets).
Why MongoDB?
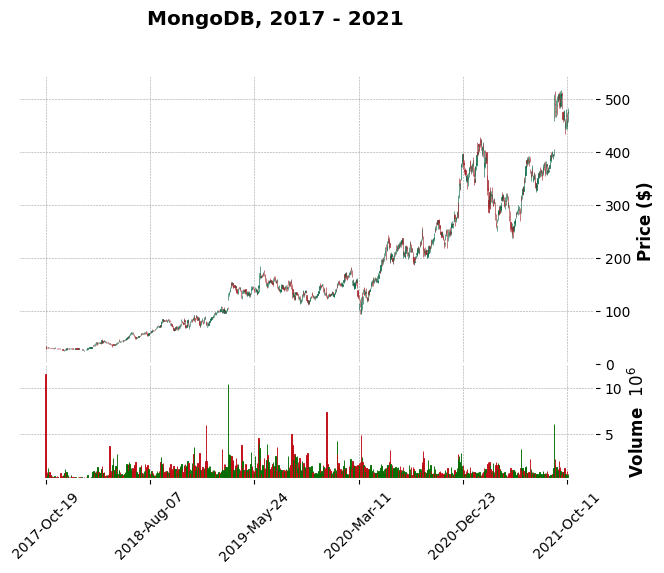
When I first started in the data science field in 2017, MongoDB was widely regarded as database for beginners; because along with document schema flexibility came less impressive performance as compared to Postgres/RedShift, or even MS SQL. Over the past 5 years, a lot of that has changed. If you track the impressive 8000% increase in the stock of MongoDB, that really says it all.
https://gist.github.com/xiangjerryhe/d2930c1e70e5c4b23d4e3118ee22615f
Not did MongoDB up its performance; the new features it has added over the years has made it the NoSQL database of choice. Full disclaimer, I don’t work for MongoDB.
An added bonus is that I can run it from an Android phone using this app I found; although this one is running version 3.x, which is a dinosaur compare to the latest version but it still works with the pymongo python module and all the scripts I’ve shared in this blog. If anyone knows a better Android app for MongoDB server please share in comments.
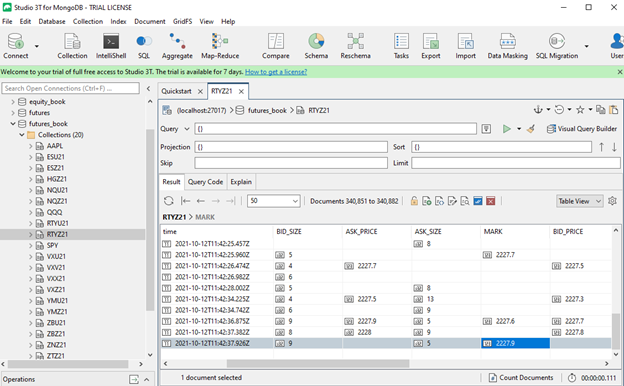
Level 1 market data and beyond
If the yfinance package can do everything that TDAmeritrade API can, then why bother with TDAmeritrade API at all? Well in Week 1 of this blog series, I had introduced code to get data using the TDAmeritrade streaming API. Not only do you get sub-1-second granularity with streaming data, but you also get other level 1 details such as bidSize, askSize; which can be important variables for quick price prediction on the high-frequency scale. The data (for Russell futures) looks somewhat like the picture below on MongoDB.
Since processing and predicting on Level 1 and Level 2 market data is somewhat advanced topic, I’ll be posting about it in Week 8. Week 5–7 will be mostly about writing trading code in python.


