
How to carry out a simple time series analysis on financial data using pandas
Time series analysis is a method of collecting data over a specific period of time. It is a specific way of analysing a sequence of data points collected over an interval of time. The analysis record the data points over specific interval of time, such as a day, week, month or year.
There are many areas where time series analysis can come in handy, such as recording sunspot data, energy consumption, sales, or even the stock market.
In this post I have taken stock market data from Facebook to cover the period from the beginning of the pandemic, being the early part of 2020, going through the current date, being the end of August 2021. So far, the pandemic has lasted over a year and a half and I thought it would be a good idea to see how this social media has fared.
I used the stock market data from Google Finance, and the link to this site can be found here:- https://www.google.com/finance/quote/FB:NASDAQ
I also used a spreadsheet that I created to download the stock prices from Google Finance to Google sheets. This spreadsheet has been shared and can be viewed here:- https://docs.google.com/spreadsheets/d/1Oh8Y0Pr6ICb7urvUb0nhsPu1abNcfhrrO22IDNTMSbg/edit?usp=sharing
I have written the script in Google Colab because it is a free online Jupyter Notebook that the Python programming language can be written in. Google Colab is a great program because, aside from the fact it is free, it is portable and can be used on any computer that has the internet connected to it. The only drawback that I have found with Google Colab is the fact that it does not have an undo function, so care needs to be taken not to overwrite or delete valuable code because, if that occurs, it will be lost forever.
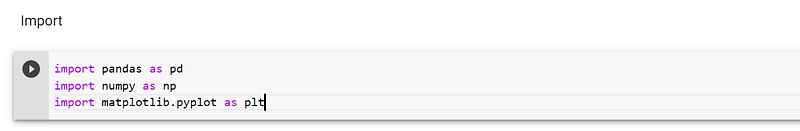
Once I created the program, I imported the libraries that I would need to execute the program. The libraries I imported on this occasion were pandas, numpy, and matplotlib. Pandas creates and manipulates dataframes, as well as having methods that help with carrying out a time series analysis, numpy creates arrays and carries out algebraic computations, and matplotlib plots the data points on a graph:-
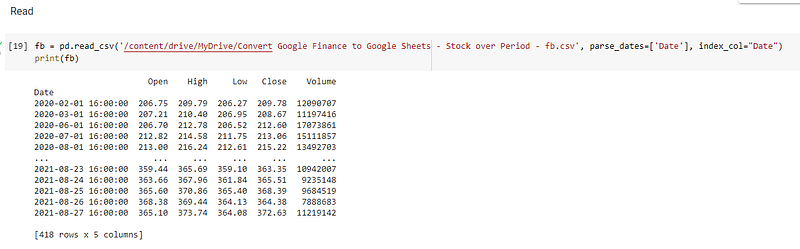
I then used pandas to read the csv file that I had created from the Google Sheet and saved into my Google Drive into the program. I parsed the date column and made it the index. The parse_dates parameter is used to turn things into real datetime types. I then printed out the dataframe, fb, which revealed the index to be the column, Date:-
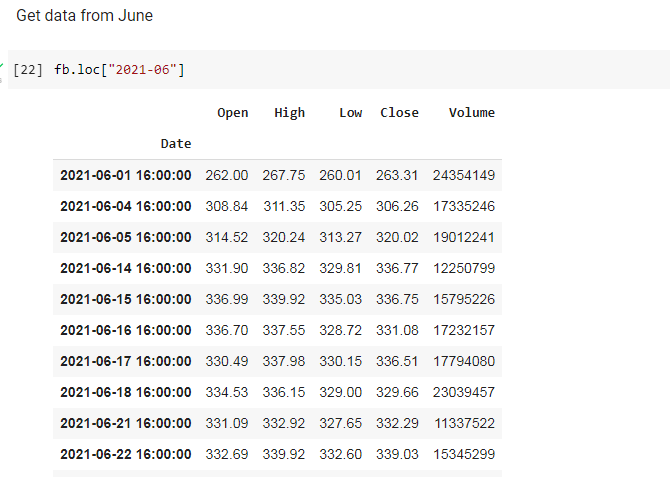
As an exercise, I retrieved the data from June 2021:-
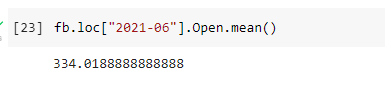
I then obtained the mean of the data from the Column, Open, for the mean of that column:-
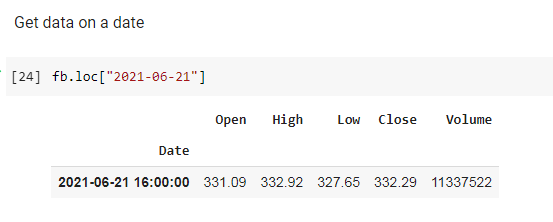
I then obtained data on only one date, being 21 June 2021:-
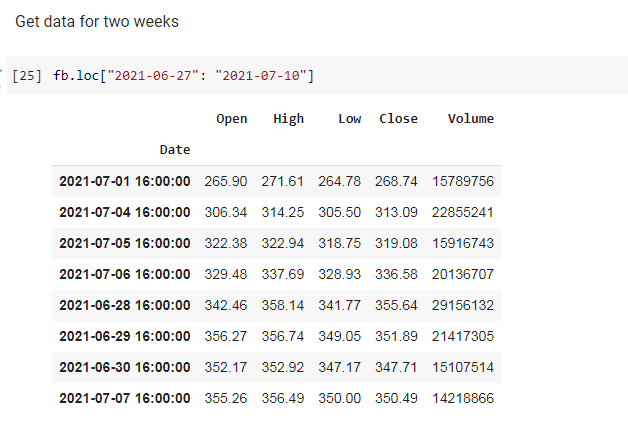
I also obtained data for two weeks, starting on 27 June 2021:-
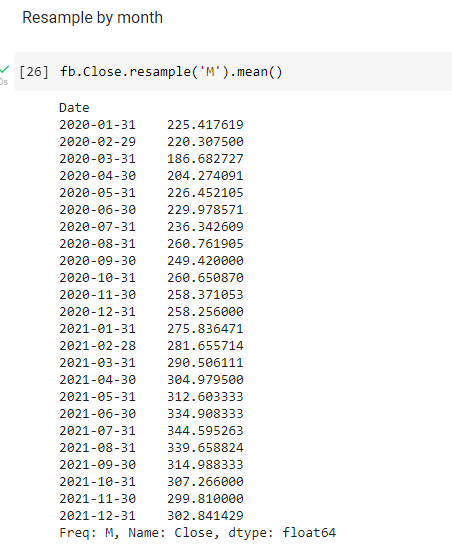
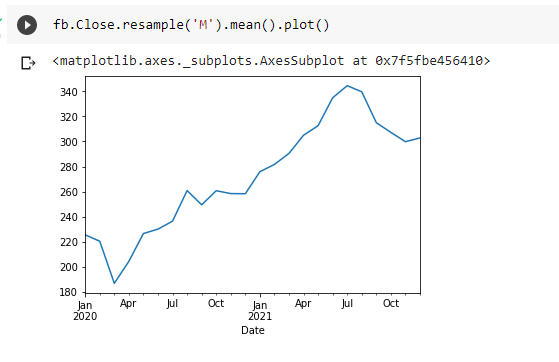
It is also possible to resample the mean of the column, Close, on a monthly basis:-
I then plotted a graph of the monthly resampling of the column, Close, using pandas. The great thing about using pandas on top of matplotlib is the fact that it only requires one line of code to accomplish this:-
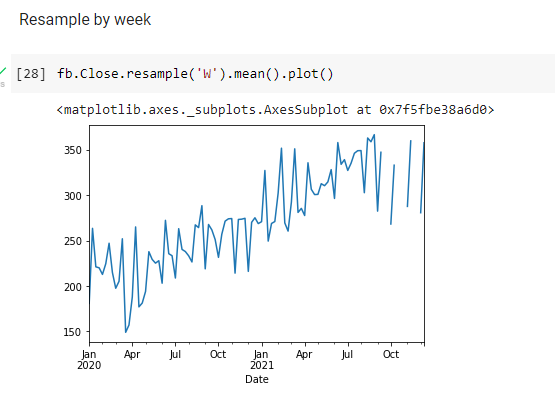
I can also resample the column, Close, by the week:-
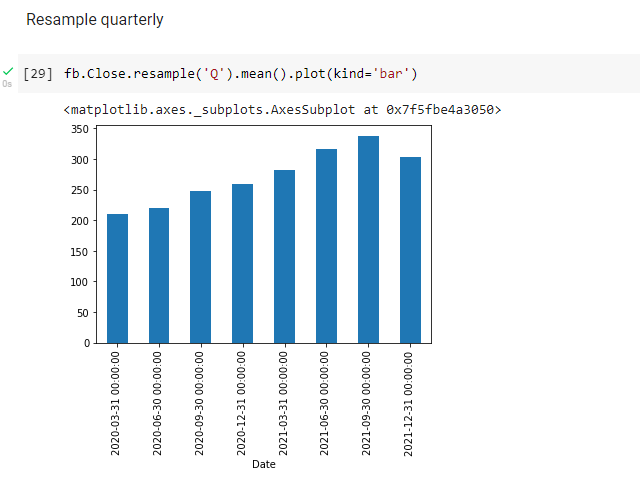
It is also possible to sample the data on a quarterly basis:-
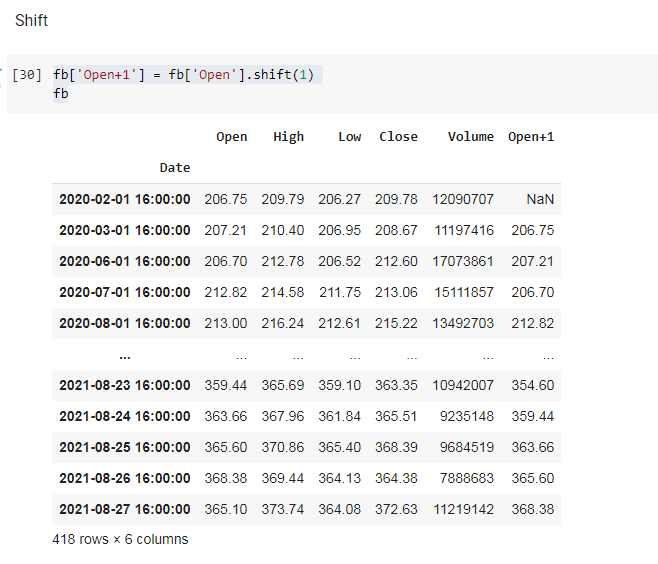
In order to begin the process of conducting a time series analysis, a new column was created, Open+1, which shifts the data in the column, Open, by one day:-
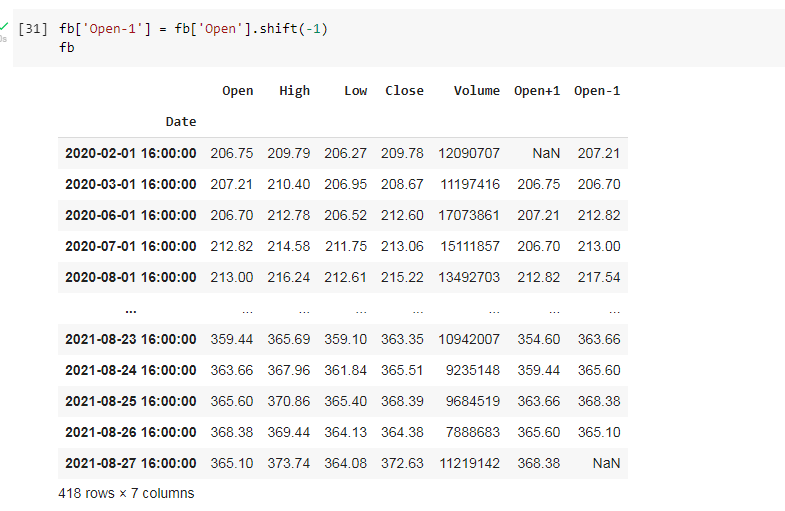
It is also possible to shift the day by -1 day. I created a column, Open-1, and used the shift method, placing a -1 inside the brackets:-
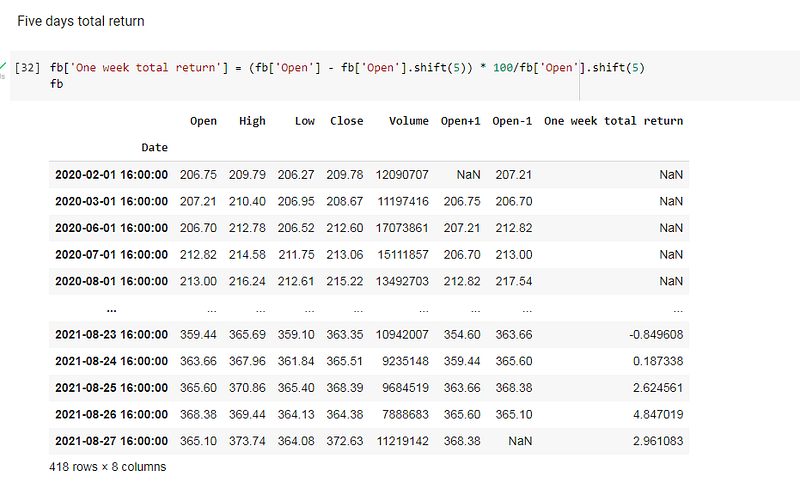
It is also possible to obtain the one week total return by creating a new column and inserting the formula:-
(fb[‘Open’] — fb[‘Open’].shift(5)) * 100/fb[‘Open’].shift(5)
This concludes some of the techniques used to perform a time series analysis using the pandas library. In future blogs I will go into greater detail into how to use different libraries and techniques to analyse time based data.
The code for this post can be viewed in Google Colab, the link being here:- https://colab.research.google.com/drive/1KmjVWlDSYOkgt3hr-PeLDmDtsfIhQbEJ?usp=sharing