
Investing Basics
How To Quickly Calculate The Value Of A Stock (with Template)
The key to successful stock picking
Intrinsic value is the most important metric to determine investing returns. That’s because you can only make money investing in stocks if you buy when the price is below or equal to its fair intrinsic value.
So, here is a straightforward guide on how to easily and quickly calculate it for any stock you’d like — using a free excel template you can download below. It’s a Discounted Cash Flow Analysis, and I won’t discuss the theory behind this method — you can already read about it here:

Methodology
The discounted cash flow (DCF) analysis is perhaps the most common valuation method out there. It’s how Wall Street values stocks and it’s a great way to estimate potential investment returns.
It’s a great method to analyze most publicly traded companies, but it’s unfortunately not perfect. Because of the fact that you are analyzing future cashflows, this method requires businesses to be profitable and produce cash in order to be evaluated. This means it’s not good for banks or unprofitable companies since, well, neither of those fit the criteria. But it should be fine for most other businesses.
Elements needed
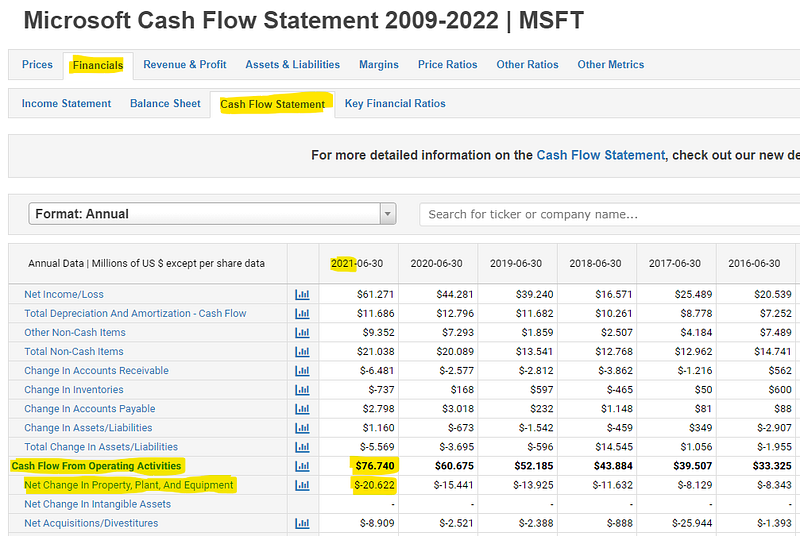
The Free Cash Flow (FCF) is the key element of this analysis. It’s the total amount of money the business generated during a current year after all its expenses. In normal circumstances, if the firm has good accountants it should be a similar number to the net profit. It is calculated as the following:
FCF = Operating Cash Flow (OCF) — Capital Expenditures (CapEx).
The OCF is the Cash from Operations: it’s the net cash the operating business generates (before the cash is used to invest, pay dividends or pay down debt). Capital Expenditures are instead the money the management uses to acquire, maintain or upgrade the physical assets of the firm — like buildings, machines, and technology, which is why this line is also known as “Change in Property, Plant and Equipment”. If you subtract CapEx from OCF, you get the total amount of money the management has in its hands, a sum that is technically the property of shareholders and creditors.
The next thing you’re going to need is a personal discount rate. This is your own personal desired return: I personally use an arbitrary 10% rate of desired return, but you can also use the WACC if you prefer.
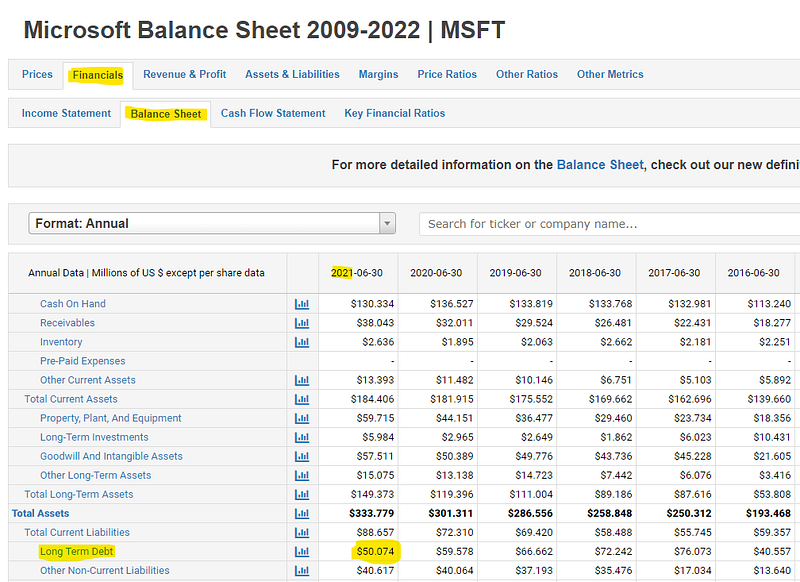
The next thing you’ll need is the amount of Debt and Excess Cash the company has, since those also influence how the business is worth. The reason behind that is simple: when you’re buying a business with $1M in the bank, you’re definitely going to pay a million dollars more on top of the price of the business. The opposite applies to debt.
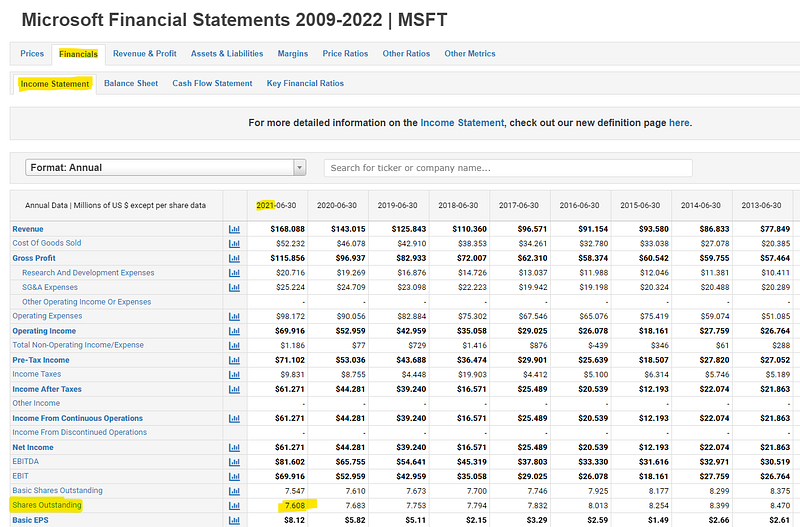
And finally, the last thing you’ll need is the number of shares outstanding, in order to reconcile the value of the business and the one of the stock. You can either fetch it directly from Excel/Google Sheets or look it up at the bottom of the income statement. It’s really easy to find.
In practical terms, there are a few different places where to find the information above.
The first and also best method is to look through the company’s annual report. This is the most appropriate way since you can be sure the numbers are accurate and also read about the business in the first place, but also not the most convenient method since it does require a bit of time.
The second one is by using a (free) third-party website, which is definitely the easier alternative. As you can see from above, there are free websites that collect all this information about different public complies. The problem is that sometimes these websites have errors in the numbers, which might obviously screw up your whole valuation, so use them with caution. My personal favorites websites of this kind are TIKR Terminal and MacroTrends — the first one has more accurate and in-depth data (including analyst estimates for FCF), the other on the other hand doesn’t require an account to be used.
Using the template
After you collected all this useful data, you can finally put it to work and find the value of the company’s stock. To do that you will have to download the template (instructions below), which looks something like this.
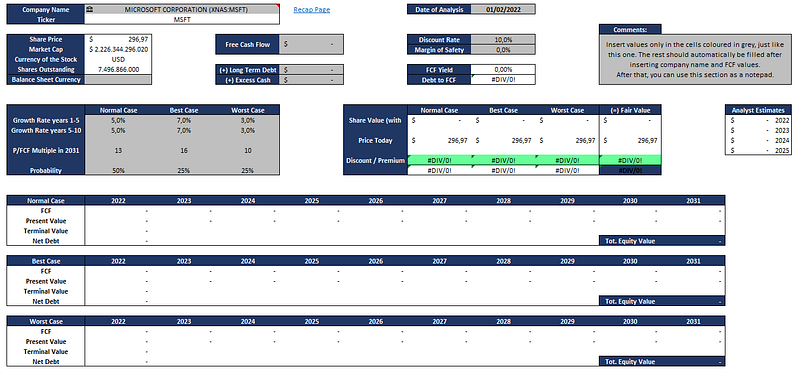
The template is made so that you should only be filling the cells colored in dark grey. With that being said, you are going to insert the data you collected about the business in the first section, as discussed above.
The first thing to fill in is the name of the firm and the currency of its balance sheet, which should automatically fill in the number of shares and market cap. If it doesn’t, you can also manually insert the number of shares and the market cap in the cells below.
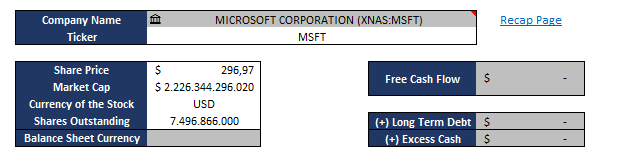
After that, it’s time to insert the rest of the information collected above in their respective cells, all with a positive sign. Once this is done, most of the template should already start to do its thing and values should start to pop up.
Unfortunately, the work is not finished yet. In the section below, you will need to make some assumptions about growth and valuation.
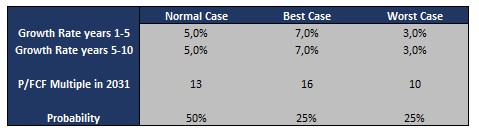
The template is built to analyze three different scenarios. A normal one, a best-case and a worst-case scenario. For each one, you should input the following:
- A growth rate for cashflows for the next five years.
- A growth rate for cashflows for the five years after that.
- A Price to FCF terminal multiple, meaning what P/FCF you think the stock will have ten years down the line. If it sounds intimidating, you can look at it like a P/E Ratio since it’s basically the same thing.
- Different probabilities for each scenario. The standard is 50–25–25%, but you can also do 33–33–34 and so on. The only thing this value changes is the final value of the stock, which is the weighted average of the different scenarios and their respective probability.
Once that’s done, only a couple of things remain.
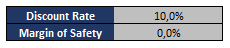
The first thing is your personal discount rate, as discussed above, and the second thing is a margin of safety. What this last value does is haircut the final value you get by this selected percentage, just in case you’re not sure about what you’re doing and want to play it even safer.
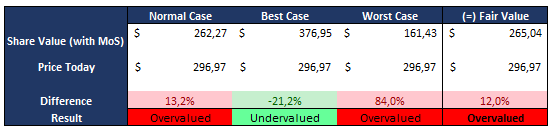
And that’s about it. With all the data correctly filled in, the end result should look something like this, and you should have a pretty clear picture of the value of the business and the difference with its stock price.
The next step: bulletproofing your assumptions
As you can see when playing around with the numbers, the valuation changes drastically depending on what growth rates you input.
This leads me to the next most important thing to do after this: bulletproofing your estimates. This means making sure the estimates are reasonable and could actually happen, and it’s perhaps the most important part of this whole process. There’s a reason people listen to conference calls from the management, it’s to learn and understand the business.
If investing was as easy as putting some numbers in and watching an excel box turn green or red, then everyone would be beating the market. Unfortunately, this is only the start, and the next steps (studying the business) count probably even more than this one.
And that’s about it! If you’d like to know more, just feel free to ask in the comments/replies.
If you want to download the template I showed above, you can do two things:
- click here, and then create your own copy of the file in Google Drive.
- click here, and then create your own copy of the file in Microsoft OneDrive.
One last thing: all the above is not intended to be financial advice. Feel free to get in touch if you have any questions or want to learn more :)
Schedule a DDIChat Session in Personal Finance:
Apply to be a DDIChat Expert here. Work with DDI: https://datadriveninvestor.com/collaborate Subscribe to DDIntel here.