
Build a Momentum Screener for over 13K Crypto Coins for Free (in Python)

Photo by Kanchanara on Unsplash.com
That’s right, folks. I’m not messing with you. A free screener for 13,418 crypto coins. Sweet!
So, what are am I really trying to achieve this post? I was initially trying to build a screener that would catch coins bouncing back after the market turndown making them attractive for investment.
This story is solely for general information purposes, and should not be relied upon for trading recommendations or financial advice. Source code and information is provided for educational purposes only, and should not be relied upon to make an investment decision. Please review my full cautionary guidance before continuing.
However, I realized that the screener can be repurposed for other tasks, e.g.
- Pull coin details from CoinGecko.
- Perform technical analysis on the stock price.
- Hook it up to a news sentiment analysis
- Feed the info to a scraper to fetch data from the coin websites
- Building a coin info database, etc.
Trade Ideas provides AI stock suggestions, AI alerts, scanning, automated trading, real-time stock market data, charting, educational resources, and more. Get a 15% discount with promo code ‘BOTRADING15’.
The Strategy
The purpose of this screener is to identify coins, that are in the process of bouncing back from the recent market turndown. So the core of my momentum strategy is using Moving Averages (MAs) to detect upward trends.
I’m using three different MAs: 60, 40 and 15 periods. The 30 day price data from CoinGecko is fetched in 4 hour intervals. That gives us 180 periods.
We need to consider that some lead periods are used to calculate the MA. I chose the three MA periods because I wanted to detect fairly recent upward trends. 60 periods equate to 10 days considering the 4 hour intervals. Adding the other two MAs will allow us to detect the more recent upwards trends in the last few days.
The second component of the strategy is the RSI. The RSI is traditionally used to identify overbought assets. However, in cases of strong upward trends the RSI can stay in the high numbers (e.g. over 80) for extended periods.
Combining both components should help us identify coins with a strong upwards price trends.
Here the strategy rules I used:
- 40 MA has to be greater 60 MA
- 60 MA has to be greater than 60 MA 2 days ago
- 15 MA has to be greater than 40MA
- Close price has to be greater 60 MA
- Close price has to be greater 40 MA
- Close price has to be greater 15 MA
- Close price has to be within 30 of the 180 period low price
- RSI has to be greater or equal to 80.
Technologies Used
So how do we make this magic happen? This screener is possible thanks to the generous folks at CoinGecko and their CoinGecko API. They provide a number of APIs for coin info, coin prices, and market information for free. You don’t even have to register.
In particular I’m using the following APIs:
- /coins/list — Fetches the list of coins and CoinGecko id. We will retrieve the results from my GitHub repo instead for faster performance.
- /coins/{id}/ohlc — To retrieve coin pricing info
- /coins/{id} — To retrieve general coin information
The only big restriction here is a 50-call per minute limit. I’m getting around that by throttling my calls to CoinGecko.
Here the link to the official CoinGeck API documentation.
We will be using an unofficial CoinGecko client for Python called ‘coingecko’. Here the GitHub documentation for the library.
To calculate the technical indicators, I used the pandas-ta library.
To generate the HTML page we will be using the Python library Yattag and the docs can be found here.
Implementation
You can find the full implementation of the screener on my repo here.
Here the required Python imports. You may have to install them first.
from datetime import datetime
import pandas as pd
import pandas_ta as ta
import datetime
from pandas.tseries.holiday import USFederalHolidayCalendar
from pandas.tseries.offsets import CustomBusinessDay
US_BUSINESS_DAY = CustomBusinessDay(calendar=USFederalHolidayCalendar())
import matplotlib.pyplot as plt
import plotly.graph_objects as go
from plotly.subplots import make_subplots
from pycoingecko import CoinGeckoAPI
import time
from yattag import Doc
import requests
This function fetches the list of coins. I placed the result JSON on my GitHub repo for faster performance.
def get_coin_ids():
    try:
        #  Slow response on Coingecko
        # uri = 'https://api.coingecko.com/api/v3/coins/list'
        uri = 'https://raw.githubusercontent.com/justmobiledev/python-algorithmic-trading/main/data/coingecko-list.json'
        response = requests.get(uri).json()
return response except Exception as e:
print('Failed to look up Coinbase assets', e)
return NoneThis function calculates the Moving Averages and RSI using the pandas-ta library.
def calculate_technical_indicators(df):
    df['60_MA'] = df['close'].rolling(window=60).mean()
    df['40_MA'] = df['close'].rolling(window=40).mean()
    df['15_MA'] = df['close'].rolling(window=15).mean()
    df['RSI'] = ta.rsi(df["close"], length=14)
return dfThe next function calculates the metrics we need for our strategy.
def calculate_metrics(df):
    #  Values 2 days ago. 6 values per day (data every 4 hours)
    df['60_MA_2d_ago'] = df.iloc[-12]['60_MA']
    df['40_MA_2d_ago'] = df.iloc[-12]['40_MA']
    df['RSI_2d_ago'] = df.iloc[-12]['RSI']
# Values 5 days ago. 6 values per day (data every 4 hours)
df['60_MA_5d_ago'] = df.iloc[-30]['60_MA']
df['40_MA_5d_ago'] = df.iloc[-30]['40_MA']
df['RSI_5d_ago'] = df.iloc[-30]['RSI'] # min and max
df['min_close'] = df['close'].min()
df['max_close'] = df['close'].max() # Condition 6: Current Price is at least 30% above 52-week low
df['within_close_low'] = df['min_close'] * 1.30
# Condition 7: Current Price is within 90% of 52-week high
df['within_close_high'] = df['max_close'] * 0.90 return dfThe next block evaluates the different rules we defined for our strategy (see Strategy section above).
def evaluate_conditions(df):
    df['condition1'] = (df['close'] > df['60_MA']) & (df['close'] > df['60_MA'])
    df['condition2'] = df['40_MA'] > df['60_MA']
    df['condition3'] = df['60_MA'] > df['60_MA_2d_ago']
    df['condition4'] = (df['40_MA'] > df['60_MA']) & (df['15_MA'] > df['40_MA'])
    df['condition5'] = df['close'] > df['15_MA']
    df['condition6'] = df['close'] < df['within_close_low']
    df['condition7'] = df['RSI_2d_ago'] >= 80
# Select stocks where all conditions are met
query = "condition1 == True & condition2 == True & condition3 == True & condition4 == True & \
condition5 == True & condition6 == True & condition7 == True" selection_df = df.query(query) return selection_dfHere we are fetching the coin price data for the last 30 days in open, high, low, close format from CoinGecko.
def get_ohlc(cg, coin_id, vs_currency, days):
    try:
        response = cg.get_coin_ohlc_by_id(coin_id, vs_currency=vs_currency, days=days)
ohlc_df = pd.DataFrame()
for ohlc in response:
row = pd.DataFrame(
{'epoch': [ohlc[0]], 'open': [ohlc[1]], 'high': [ohlc[2]], 'low': [ohlc[3]], 'close': [ohlc[4]]})
ohlc_df = pd.concat([ohlc_df, row], axis=0, ignore_index=True) return ohlc_df
except Exception as e:
print('Failed to fetch CoinGecko price info', e)
return NoneThis next function retrieves general coin information from CoinGecko and parses the results. We are going to use this information to build out HTML report.
def get_coin_info(cg, coin_id):
    try:
        response = cg.get_coin_by_id(coin_id)
        categories = response['categories']
        public_notice = response['public_notice']
        name = response['name']
        description = response['description']['en']
        links = response['links']
        homepage_link = links['homepage']
        blockchain_site = links['blockchain_site']
        if blockchain_site is not None:
            blockchain_site = ",".join(blockchain_site)
        official_forum_url = links['official_forum_url']
        chat_url = links['chat_url']
        announcement_url = links['announcement_url']
        twitter_screen_name = links['twitter_screen_name']
        facebook_username = links['facebook_username']
        telegram_channel_identifier = links['telegram_channel_identifier']
        subreddit_url = links['subreddit_url']
        sentiment_votes_up_percentage = response['sentiment_votes_up_percentage']
        sentiment_votes_down_percentage = response['sentiment_votes_down_percentage']
        market_cap_rank = response['market_cap_rank']
        coingecko_rank = response['coingecko_rank']
        coingecko_score = response['coingecko_score']
        community_score = response['community_score']
        liquidity_score = response['liquidity_score']
        public_interest_score = response['public_interest_score']
row = pd.DataFrame(
{'id': [coin_id], 'name': [name], 'categories': [categories], 'public_notice': [public_notice], \
'description': [description], 'homepage_link': [homepage_link], \
'blockchain_site': [blockchain_site], 'official_forum_url': [official_forum_url], \
'chat_url': [chat_url], 'announcement_url': [announcement_url], \
'twitter_screen_name': [twitter_screen_name], 'facebook_username': [facebook_username], \
'telegram_channel_identifier': [telegram_channel_identifier], 'subreddit_url': [subreddit_url], \
'sentiment_votes_up_percentage': [sentiment_votes_up_percentage], \
'sentiment_votes_down_percentage': [sentiment_votes_down_percentage], \
'market_cap_rank': [market_cap_rank], \
'coingecko_rank': [coingecko_rank], \
'coingecko_score': [coingecko_score], 'coingecko_score': [coingecko_score], \
'community_score': [community_score], 'liquidity_score': [liquidity_score], \
'public_interest_score': [public_interest_score]})
row = row.set_index('id')
return row
except Exception as e:
print('Failed to fetch CoinGecko coin info', e)
return NoneThis function builds the HTML report of the coins that match our criteria using the Yattag Python library. The report is stored in the same directory with the file name ‘screener-coins-report.html’.
def build_report(coin_ids, info_map):
    # doc, tag, text, line = Doc().tagtext()
    doc, tag, text, line = Doc().ttl()
    now_str = datetime.datetime.now().strftime("%d/%m/%Y %H:%M:%S")
with tag('html'):
with tag('head'):
with tag('style'):
text("""div{ width: 100%; }
html { margin: 0; padding: 10px; background: #1e81b0;}
body { font: 12px verdana, sans-serif;line-height: 1.88889; margin: 5%; background: #ffffff; padding: 1%; width: 90%; }
p { margin-top: 5px; text-align: justify; font: normal 0.9em verdana, sans-serif;color:#484848}
li { font: normal 0.8em verdana, sans-serif;color:#484848}
h1 { font: normal 1.8em verdana, sans-serif; letter-spacing: 1px; margin-bottom: 0; color: #063970,}
h2 { font: normal 1.6em verdana, sans-serif; letter-spacing: 1px; margin-bottom: 0; color: #154c79}
h3 { font: normal 1.6em verdana, sans-serif; letter-spacing: 1px; margin-bottom: 0; color: #154c79}
p.bold_text{ font: normal 0.9em verdana, sans-serif; letter-spacing: 1px; margin-bottom: 0; color: #154c79; font-weight: bold}""") with tag('body', id='body'):
with tag('h1'):
text(f"Trending Crypto Report for {now_str}")
with tag('hr'):
text('') for coin_id in coin_ids:
coin_df = info_map[coin_id]
with tag('h2'):
text(f"{coin_id.upper()}")
with tag('div'):
line('p', f"Name: {coin_df['name'].values[0]}", klass="bold_text")
line('p', coin_df['name'].values[0])
line('p', f"Description:", klass="bold_text")
line('p', coin_df['description'].values[0])
line('p', f"Categories:", klass="bold_text")
category_list = ""
if coin_df['categories'].values[0] is not None:
for category_str in coin_df['categories'].values[0]:
if category_str is None:
continue
if len(category_list) > 0:
category_list += ", "
category_list += category_str
line('p', f"{category_list}")
line('p', f"Public Notice:", klass="bold_text")
line('p', f"{coin_df['public_notice'].values[0]}")
line('p', f"Links:", klass="bold_text")
with tag('ul', id='links-list'):
url_list = ""
if coin_df['homepage_link'].values[0] is not None:
for link_str in coin_df['homepage_link'].values[0]:
url_list += link_str
line('li', f"Home Page: {url_list}")
line('li', f"Blockchain Site: {coin_df['blockchain_site'].values[0]}")
url_list = ""
if coin_df['official_forum_url'].values[0] is not None:
for link_str in coin_df['official_forum_url'].values[0]:
url_list += link_str
line('li', f"Official Forum URLs: {url_list}")
url_list = ""
if coin_df['chat_url'].values[0] is not None:
for link_str in coin_df['chat_url'].values[0]:
url_list += link_str
line('li', f"Chat URLs: {url_list}")
line('p', f"Social Media:", klass="bold_text")
with tag('ul', id='social-list'):
line('li', f"Twitter: {coin_df['twitter_screen_name'].values[0]}")
line('li', f"Facebook: {coin_df['facebook_username'].values[0]}")
line('li', f"Telegram: {coin_df['telegram_channel_identifier'].values[0]}")
line('p', f"Sentiment:", klass="bold_text")
with tag('ul', id='sentiment-list'):
line('li', f"Votes Up: {coin_df['sentiment_votes_up_percentage'].values[0]}")
line('li', f"Votes Down: {coin_df['sentiment_votes_down_percentage'].values[0]}")
line('p', f"Ranks:", klass="bold_text")
with tag('ul', id='sentiment-list'):
line('li', f"Market Cap Rank: {coin_df['market_cap_rank'].values[0]}")
line('li', f"Gecko Rank: {coin_df['coingecko_rank'].values[0]}")
line('li', f"Gecko Score: {coin_df['coingecko_score'].values[0]}")
line('li', f"Community Score: {coin_df['community_score'].values[0]}")
line('li', f"Public Interest Score: {coin_df['public_interest_score'].values[0]}")
with tag('div', id='photo-container'):
line('p', f"Day Plot:", klass="bold_text")
doc.stag('img', src=f"{coin_id}-ohlc-day.png", klass="day_plot")
line('p', f"Month Plot:", klass="bold_text")
doc.stag('img', src=f"{coin_id}-ohlc-month.png", klass="day_plot")
with tag('hr'):
text('') # Save report
report_file = open("screener-coins-report.html", "w")
report_file.write(doc.getvalue())
report_file.close()This last part is the main() function, which performs the following steps:
- Fetch the list of coins
- Iterate through the list of coins
- Fetch monthly pricing info for the coin
- Calculate technical indicators
- Evaluate our strategy conditions
- In case the strategy matches, get coin detail information
- Build the HTML with the matched coins.
You can see that I’m also adding a delay of 1.3 between each CoinGecko call to avoid the 50-calls-per-minute limit.
#  Initialize clients
cg = CoinGeckoAPI()
# Get all coinbase assets
max_coins = 5
month_ohlc_map = {}
info_map = {}
selected_coin_ids = []
coin_list = get_coin_ids()
num_selections = 0
max_selections = 3
i = 0
for coin in coin_list:
coin_id = coin['id']
name = coin['name']
symbol = coin['symbol'] # Skip unwanted coins
if "RealT" in name:
continue print(f"Processing '{name}', ({symbol})") # Get monthly prices - 4 hour period
ohlc_df = get_ohlc(cg, coin_id, vs_currency='usd', days=30)
if len(ohlc_df) < 30:
continue
ohlc_df = calculate_technical_indicators(ohlc_df) # Calculate SMAs and RSI
metrics_df = calculate_metrics(ohlc_df)
selections_df = evaluate_conditions(metrics_df)
if len(selections_df) > 0:
# Get coin info
time.sleep(1.3)
info_df = get_coin_info(cg, coin_id)
if info_df is None:
continue
info_map[coin_id] = info_df # Store prices
ohlc_df.to_csv(f"{coin_id}_ohlc_df.csv") print(f"-> Match: {coin_id}, {name}")
selected_coin_ids.append(coin_id) num_selections += 1
if num_selections >= max_selections:
break time.sleep(1.3)# Build report
build_report(selected_coin_ids, info_map)Results
Let’s take a look at some of the results this screener generated. Keep in mind that the screener will take a while to run due to the CoinGecko API limits. If you let it process all 13K+ coins, it will take about 4.5 hours.
While it is running, the script will print out the different coin names and symbols as it chucks along through the list of coins.
...
Processing 'Ethos Project', (ethos)
Processing 'ETHPad', (ethpad)
Processing 'ETHplode', (ethplo)
Processing 'ETHPlus', (ethp)
Processing 'Eth Shiba', (ethshib)
Processing 'ETHST Governance', (et)
Processing 'ETHUP', (ethup)
Processing 'ETH Variable Leverage Long', (methmoon)
Processing 'Ethverse', (ethv)
...
Once the screener has found three coins that match our strategy, I decided to exit the screening process and build our HTML report. The report contains general information about the coins that match our strategy, e.g.
- Name
- Description
- Categories
- Links (e.g. hompage, Blockchain URL)
- Social Media handles
- Sentiment
- Rank.
Below a sample output for ‘Coinsale’. You can see the full report on my GitHub repo here.
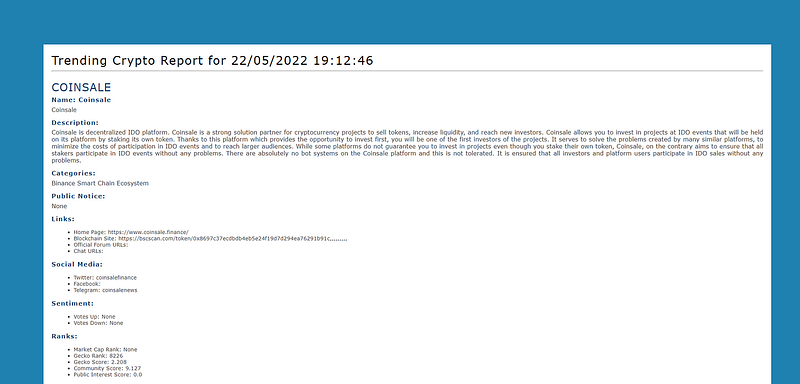
Image: Custom HTML report
In my last run, I found three coins that matched my criteria: coinsale, cryptopunt and idle-dai-risk-adjusted.
Let’s take a look at the price graphs for those coins.
coinsale
Here in the case of the coinsale coin, the strategy worked out beautifully. We are just catching the coin price after bouncing off the 180 period low (green line).
The RSI graph shows the momentum of the coin by hovering above 80 for the last 30 periods.
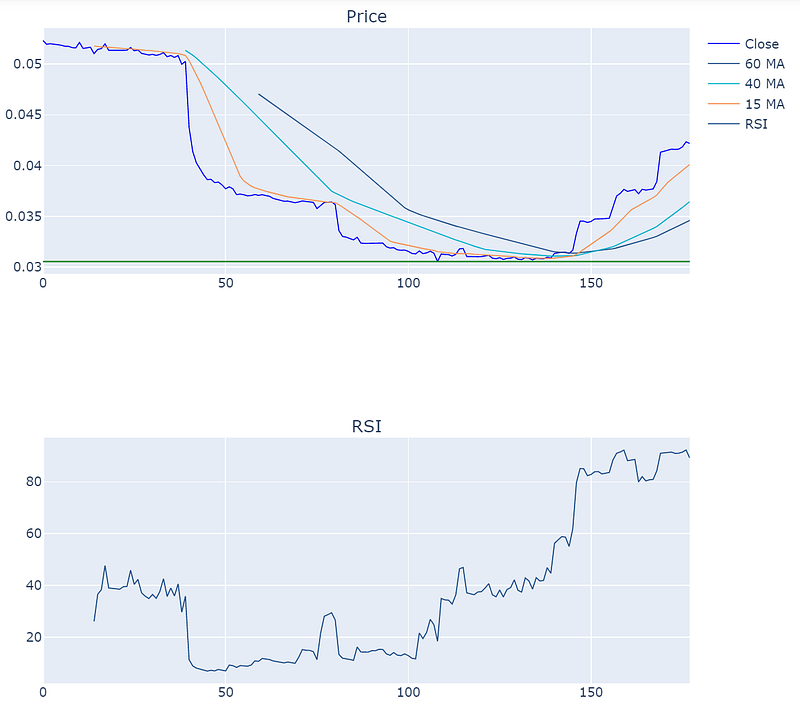
Image created with Plotly
cryptopunt
In the case of cryptopunt coin we identified another recent spike in the coin price. However, the price drops back down in the last few periods. Further research may be useful to see what’s going on with this coin.
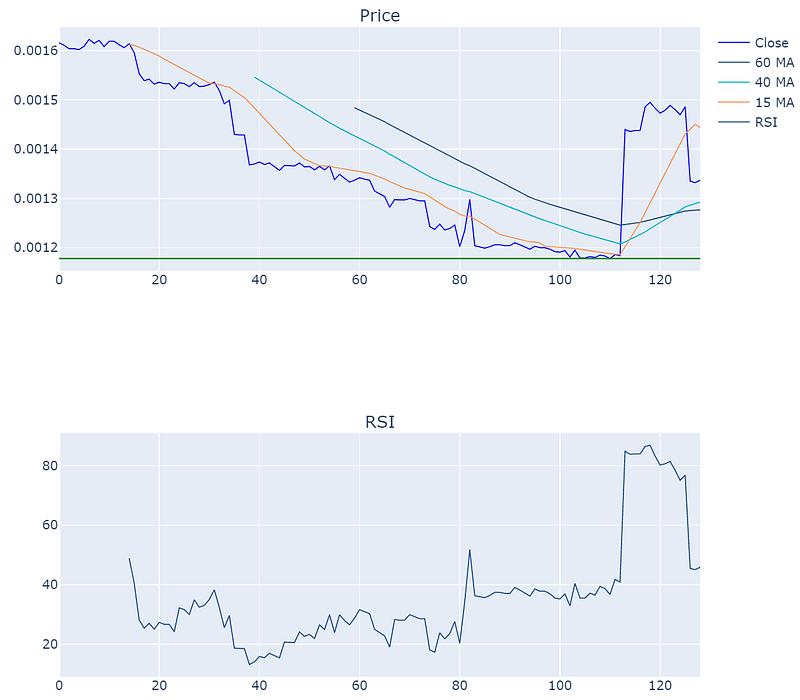
Image created with Plotly
idle-dai-risk-adjusted
Not much activity here for this coins until the last 70 or so periods. The appears to be a new coin from idle.finance on the Ethereum Blockchain. The price just jumped up from 1.07 to 1.08 in a single transaction.
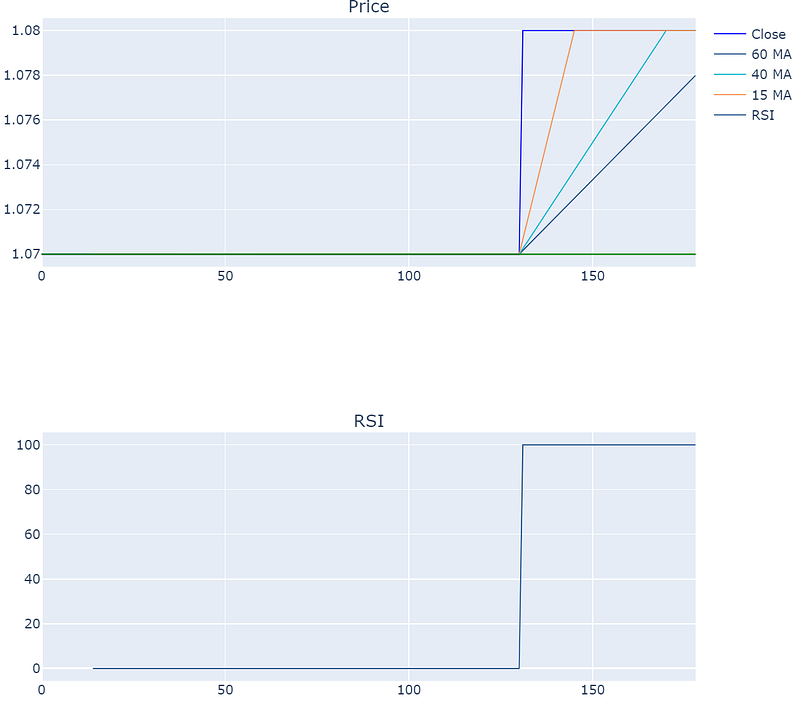
Image created with Plotly
Wrapping Up
In this post we went over step-by-step instructions to build a cryptocurrency coin momentum screener for 13K+ coins using Python. The script provides us with a HTML report of the coins that match the criteria.
You can find the full implementation of the screener on my repo here.
I hope you found this post worth your time. Thanks for reading.
You can support my writing for free using this link. Don’t miss another story — subscribe to my stories by email. For more premium content, check out my ‘B/O Trading Blog’ on Substack.
This post contains affiliate marketing links.
Have a great day!


