
How to Automatically Generate Data Structure for Sankey Diagrams
By using Python, Pandas, Plotly
Hi everyone. I am Baysan from Turkey. I had been writing about Django until I decided to write this story. You can get that series from below:
In this story, we will try to cover how we can automatically generate data structure for using in Sankey diagrams. To do that, we will be coding a function to generate data structure from any data frame and using Plotly for creating a diagram. Of course, also will be using Pandas for manipulating data.

We will use Natural Disasters 1900–2021 dataset from Kaggle. You can download the dataset by using the following link:
Before we start, a little bit explanation of what the Sankey diagram is can be good. I will be satisfied just saying this we can visualize flows by using Sankey diagrams. If you want to get more detail about that, you can visit the following links:
Let’s start coding.
Inspecting Dataset
Before we deep dive into the story, I should share this information: we will use the following packages:
import pandas as pd
import plotly.graph_objects as go
I downloaded the dataset on my local. Therefore, I can easily read it by using Pandas. The dataset is about natural disasters between 1900 and 2021. We will use some columns of this dataset.
df = pd.read_csv('EMDAT_1900-2021_NatDis.csv')df.head()
Now we can code the function which will help us for creating the data structure.
Creating Helper Function
If you glanced at Plotly’s official documentation about sankey diagrams, probably you got that we need to create nodes to denote the other nodes. To do this the data structure which we will create a few minutes later should have these columns (features, variables).
['label', 'source', 'target', 'value']I dreamed this by using dictionary data type. I think the function’s working logic is simple. The function takes a dataframe for extracting nodes from the given targeted columns in chain form. For instance:
get_sankey(df,['Region','Disaster Subgroup','Disaster Type','Disaster Subtype'],'Total Deaths')The function extracts nodes from the first argument by using the second list which is given as the second argument. Then point outs Total Deaths values as nodes’ values.
Below we can see the first 5 items for each key of the data structure.

The returned dictionary’s (the data structure which we mentioned above as we will create) keys indicate the following:
labelrefers to nodessourcerefers to parent nodes. For example, which node is my parent node. Assume this we use this key for linking.targetrefers to sub (target) nodes. For instance, which nodes are my sub-nodes. Assume this we use this key for linking.valuerefers to the represented value on the node. Here, the third parameter is used which is given to the function.
I can hear your question; “dude everything is okay but where is the main function which is doing these things” 🤓
The Function
Also, you can get the code from my Gists. Here we can see that I tried to use the easiest way. We need to give just “sankey path” in the second argument of the function. Then, it will be able to generate the data structure.
Doing Real Examples
I think before we finish, we should do a real example by using the dataset which we mentioned above.
I am going to create the data structure by using the dataset.
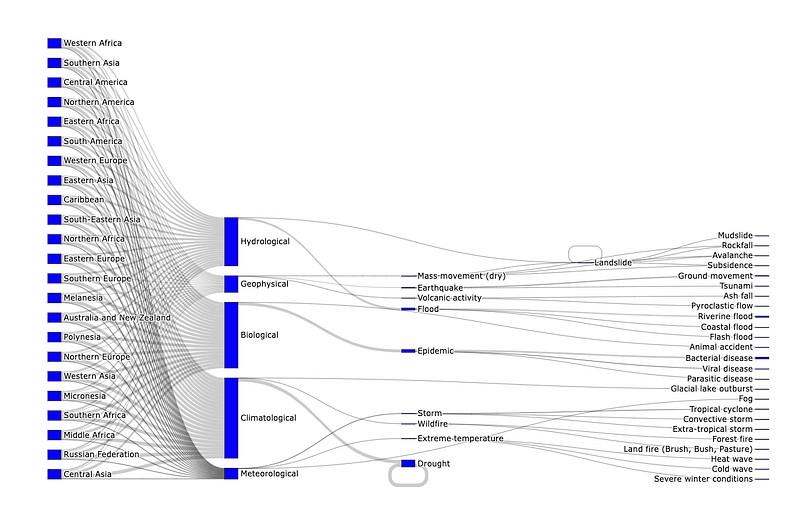
my_sankey = get_sankey(df,['Region','Disaster Subgroup','Disaster Type','Disaster Subtype'],'Total Deaths')Now, I need to create a sankey diagram by using graph_objects from Plotly. We will use the label key to create nodes in the node attribute of go.Sankey . Then, we will use the keys ( source , target ) which we have already mentioned as they help to link our nodes in the link attributes of go.Sankey .
fig = go.Figure(data=[go.Sankey(
node = dict(
  pad = 15,
  thickness = 20,
  line = dict(color = "black", width = 0.5),
  label = my_sankey['label'],
  color = "blue"
),
link = dict(
source = my_sankey['source'],
target = my_sankey['target'],
value = my_sankey['value']
))
])fig.update_layout(height=1500,margin={'t':0,'b':0})We successfully created a sankey diagram. You can use more features to create sankey diagrams by using our helper function.
Finally
Hopefully, you enjoyed reading it. I myself enjoyed writing and coding. I left to add a color attribute on the data structure as a challenge for you. Probably, if you strive for almost 15 minutes, you will be able to solve it.
Kind regards.