
How to Assess the Correlation of Stock Prices to Protect Your Portfolio
This is crucial to minimize it. Let’s see how to do this in Python with Boeing and Medtronic stocks.

If you are into finance and trading, or just want to protect your portfolio from the risk of losing it all, then you need to know how to assess the correlation of stock data.
The last thing you want is for your portfolio to have stock that moves in correlation with one another — especially if they are actually negative correlated stocks.
That’s precisely this correlation you need to know how to calculate it in Python so you can make your choices accordingly.
Disclaimer: This blog post is written only for educational purposes. There is no investment advice or promotion for any stock.
1. Concrete Use Case: Boeing and Medtronic
You are looking for stocks to invest in and are drawn to Boeing and Medtronic. Boeing manufactures airplanes, while Medtronic manufactures medical devices and provides healthcare. You chose two industries and believe you have diversified your portfolio.
But is it the case? Let’s check it.
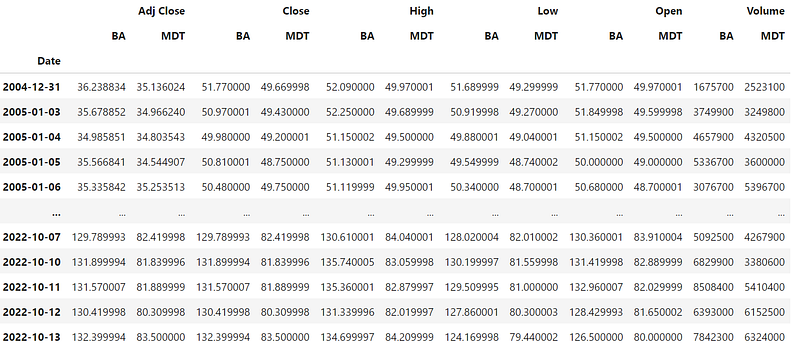
You need first to retrieve the stock data for both companies. As per my previous blog posts, let’s import yfinance and other needed libraries:
To retrieve Boeing and Medtronic stock data, we will use their tickers:
2. Plotting Stock Prices Changes and Returns
Visualizing data is always helpful so let’s plot Boeing and Medtronic stock data:
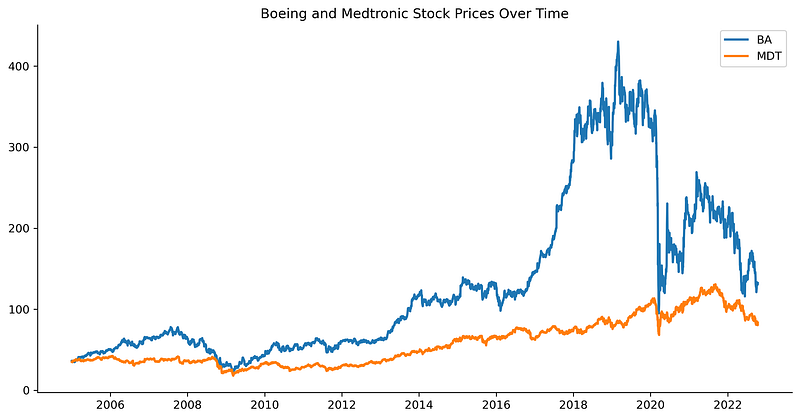
We can see from the plot that there is a visual correlation between the two stocks: their price movement seems to have similar ups and downs.
3. Regression Analysis
Let’s do a regression analysis to further our correlation analysis between these two stocks: To do so, we use the NumPy log method to calculate the logarithmic returns for both stocks and assign them variable returns:
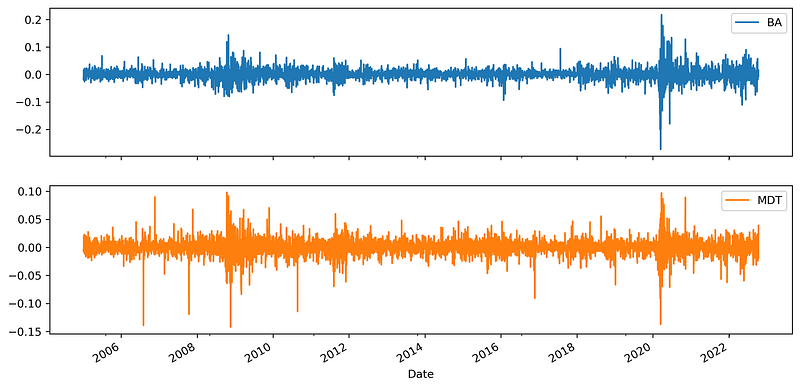
We can observe some similarities again in the volatility patterns.
Let’s perform the regression analysis.
To do so, we will use the polyfit and polyval methods.
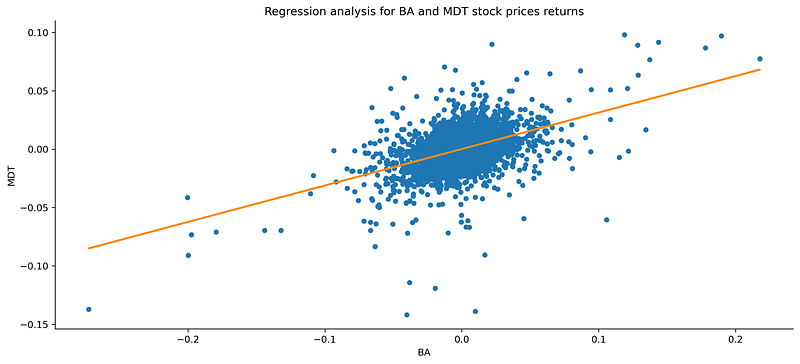
The slope of the regression line is positive, lending support to the above-mentioned postulate of a positive correlation between BA and MDT.
4. Rolling and Static Correlation
In statistics, we frequently want to know how two variables are related to one another.
The Pearson correlation coefficient, which is a measure of the linear association between two variables, is one of the most common ways we quantify a relationship between two variables in statistics.
It has a value between -1 and 1 and is calculated as follows:
- -1 denotes a perfectly negative linear correlation between two variables.
- 0 indicates that there is no linear correlation between two variables.
- 1 denotes a perfectly positive linear correlation between two variables.
Let’s see for our case here the static correlation using the .corr method. It said static as it analyzes it for the entire dataset:
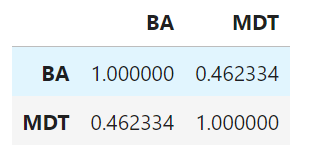
We have a 0.46 static correlation. This is considered as a weak correlation as 0.5–0.7 is moderate and greater than 0.7 is strong.
Let’s focus now on the rolling correlation using the .rolling method.
A rolling correlation is looking at a fixed window over time. We will also plot the static correlation line in orange we calculated just before.
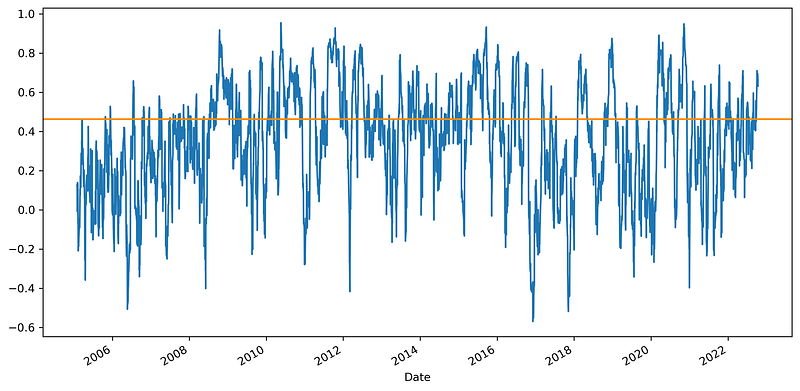
We can observe that the rolling correlation is positive most of the times. However, there are some periods where it is negative. This is aligned with the 0.46 static correlation which is close to moderate level.
Based on these elements, we can conclude that the stock prices of Boeing and Medtronic have a low correlation and present a lower risk of similar stock price patterns occurring at the same time.
Conclusion
It is critical to be cautious and diligent when selecting stocks for your portfolio. With just a few lines of Python code, you can determine whether or not there is a strong correlation between different stocks. This will help your portfolio in times like the current bear market by preventing all of your stocks from falling at the same time.
For more of these, get my free weekly newsletter “The Mindful Data Path”.
Posts | The Mindful Data Path (beehiiv.com)
Each week, I simplify a finance topic. I make you practice Data Science with me. I give you one mindful look at one piece of data.
References:
Protecting Portfolios Using Correlation Diversification (investopedia.com)
Subscribe to DDIntel Here.
Visit our website here: https://www.datadriveninvestor.com
Join our network here: https://datadriveninvestor.com/collaborate