
How to Analyze the Heart with Python (Part 1: How the Heart Works)
Use code to read electrocardiograms (EKGs) and predict heart disease.
If you already know how the heart works, skip to Step 2: How to Label EKGs with Code. See the whole EKG article series here.
The heart is a simple pump. Blood goes in, blood goes out, then it goes ‘round and ‘round the body.
And yet this simple pump can fail in a dozen unique ways — all requiring diverse, tricky medications and even implantation of pacemakers (watch-sized devices that give your heart a tiny, electrical “kick” to create heartbeats).

How do we analyze the heart?
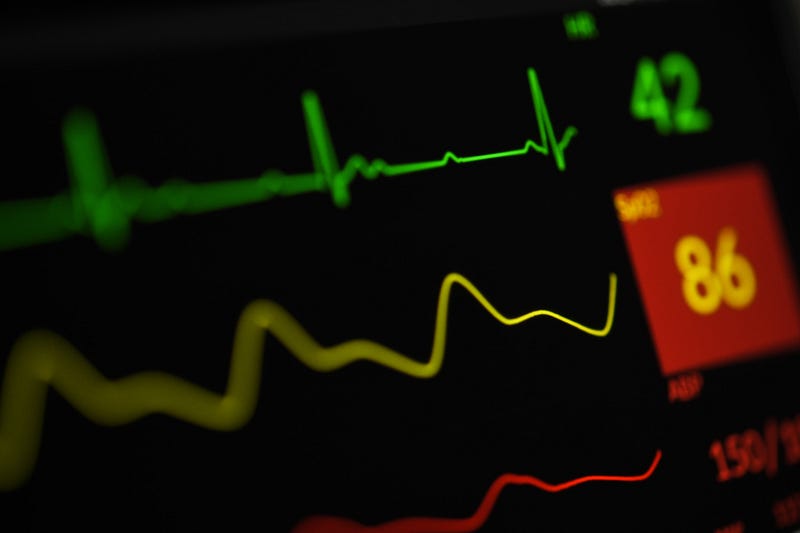
Say you’re in the hospital. When you look at your heartbeat on the monitor, you see a big spike, once for every beat.
There’s not much info there, right? The heart goes “lub-dub” then the heartbeat is over. Then the next one happens.
Actually, everything you need to know about how your heart is working is held within that squiggly line — how each part is working, the timing of each muscle squeezing, the intensity of squeeze, and more.
Any change to that classic, squiggly line (whether a part is too narrow, too wide, too fast, too slow, too tall, etc.) indicates a potentially fatal problem.
Thanks to electrocardiograms (EKGs), which create these lines, we can use Python code to measure each part of this wave and thus see if somebody has heart disease or is having a heart attack.
(The code in this series is Python-specific, but the concepts are universal to every programming language.)
The Squiggly Line: AKA the “QRS Complex”
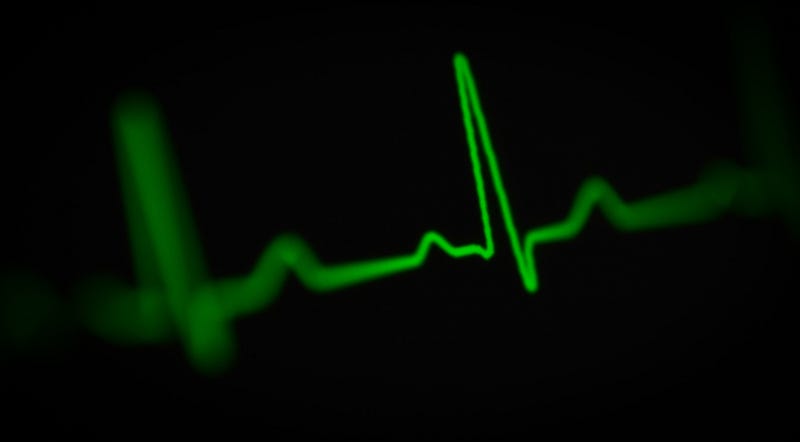
Heartbeats appear deceptively simple when you see them on a monitor. There is a big spike with some smaller bumps around it. Doesn’t seem like much is going on there at first glance.
Each bump and spike tells you which part of the heart is firing — how strongly, how quickly, and in which order.
Let’s put the QRS complex aside for a second.
The heart is a big pump made of 4 smaller pumps (the atria/ventricles) and they work like so:
- Blood fills the right atrium
- The atrium pumps blood down to the right ventricle
- The right ventricle pumps blood to the lungs to get oxygenated
- The oxygenated blood comes back from the lungs into the left atrium
- The left atrium pumps the blood down into the left ventricle
- The left ventricle pumps the blood to the rest of the body
Ignore all the veins below and just focus on the atria and ventricles (AKA the 4 “chambers”).
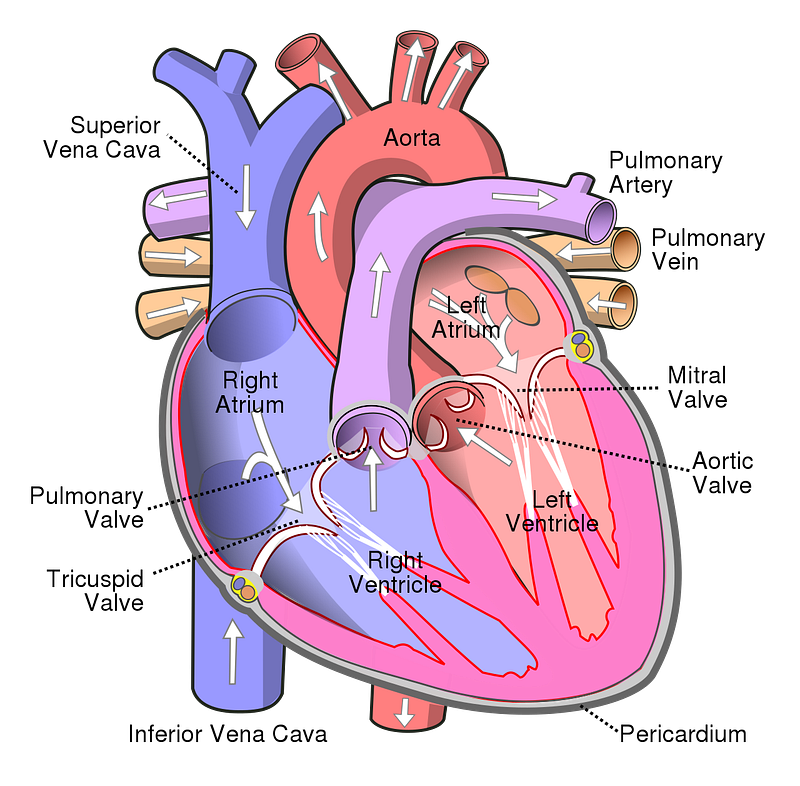
Overall, the blood goes from the right side of the heart, then to the lungs, then to the left side of the heart, then out to the rest of your body to deliver oxygen, nutrients, etc.
Right chambers → Lungs → Left chambers → Body
What does this have to do with the squiggly lines that EKGs generate?
When a muscle in the heart contracts, it creates a visible change in the voltage across the heart. Neurons, muscles, and electricity go hand in hand. EKGs are ultimately just listening in on this electricity.
When we see line of the EKG moving up and down, we’re seeing a specific set of muscles fire in quick succession with a specific order, intensity and speed. The QRS complex tells us exactly how everything is firing.
Pacemakers: How the heart knows when to fire
The heart has special neurons in it, which know how to fire at specific time intervals. These are called pacemaker cells.
The two bundles of cells most important for the timing of the heart are the:
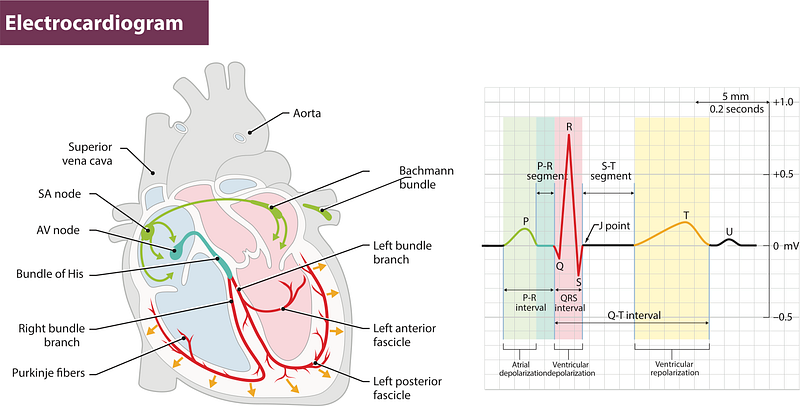
- sinoatrial node (SA node) — starts the heartbeat (the P wave)
- atrioventricular node (AV node) — slows the signal down so that the ventricles don’t fire too quickly (the PR segment)
The SA node is the natural pacemaker of the heart. It starts everything and creates the P wave.
Breaking down the QRS complex
What does each part really mean?
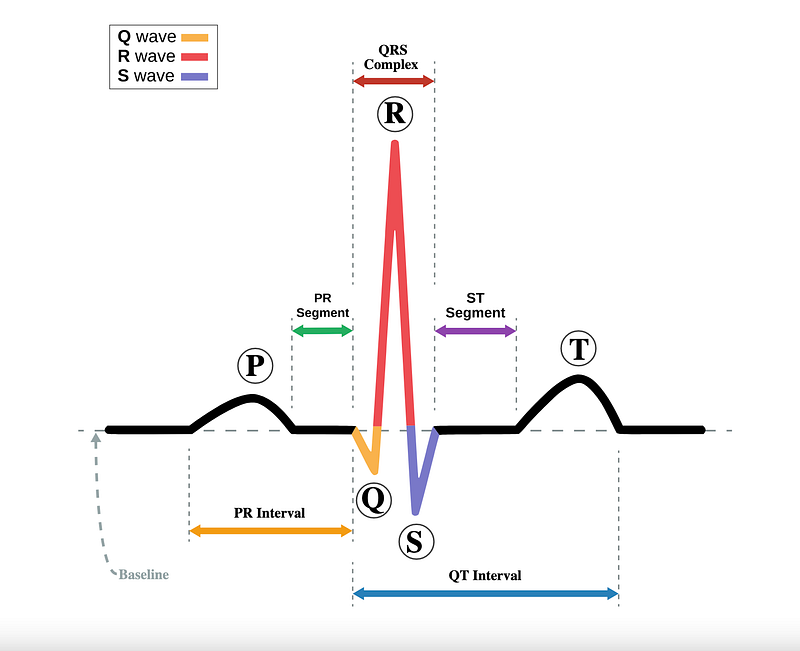
Each part of the complex is a wave assigned a letter in alphabetic order (PQRST). Each wave tells us which part of the heart is contracting.
We can refer to the whole thing as the “QRS complex” or just the main spike.
What order does everything contract in?
We did say above that the right side of the heart pumps. Then blood goes to the lungs and comes back. Then the left side pumps.
However, the heart actually pumps the left and right side at the same time.
The heart multi-tasks by:
- pumping the right and left atria at the same time, then
- pumping the right and left ventricles at the same time
That way, it can accomplish both sending blood to the lungs and sending it out to the rest of the body with just two pumps (rather than four).
When we look at a QRS complex, we’re actually seeing:
- both atria pumping (the P wave)
- both ventricles pumping (the big R wave)
- the ventricles “re-polarizing” (the T wave)
(“Re-polarizing” means “resetting” for neurons.)
In between are some flat lines where the neurons intentionally wait to continue firing, which allows each chamber to properly fill with blood.
The timing of everything is crucial, and doctors will physically measure each wave to tell if anything is off and thus diagnose a heart problem.
When things go wrong
“So a little bump then a big bump means that a heartbeat occurred. Who cares?”
True. When things are working correctly, it looks boring. It’s when heart disease and heart attacks happen that the QRS complex starts to look interesting.
Example: STEMIs
This is the EKG of the deadliest type of heart attack, called a “STEMI”:
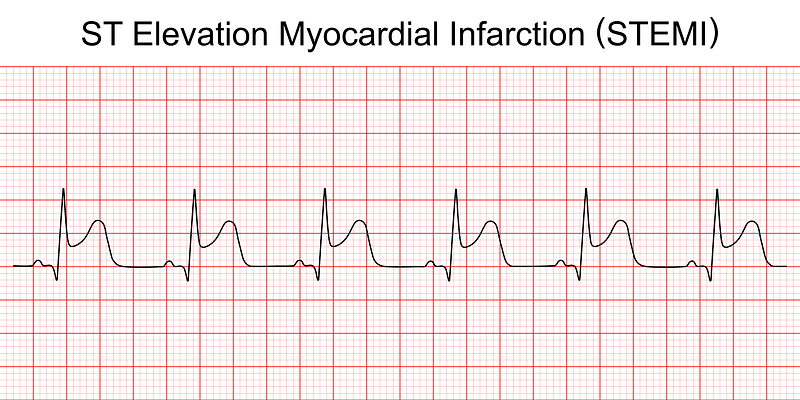
We have the usual big spike (the R wave) and a small wave to the left of it (the P wave). But there is a big bump to the right of every R wave.
This is called “ST elevation,” since the ST segment is higher than it should be. What is actually happening is that the ventricles are starting to contract properly (the R wave), but they can’t complete, since some heart muscle has completely lost blood flow.
STEMIs are caused by a complete block in one of the coronary arteries, which leads to the death of heart muscle.
We can eventually use Python code and the concepts of “digital signal processing” to identify and measure these waves and alert doctors about the possible presence of this type of heart attack.
Example: AV Blocks
Another example is when a P wave occasionally fails to kick off a heartbeat, which can happen in one of the many types of atrioventricular blocks.
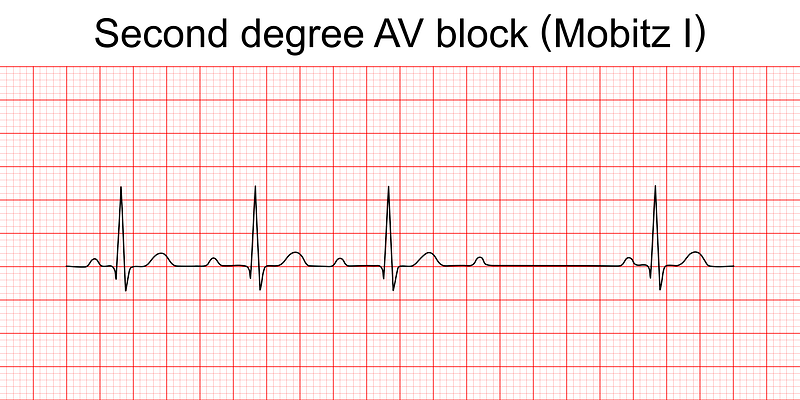
Everything is fine for the first 3 heartbeats. But when the 4th heartbeat tries to start, the P wave happens, but no R wave happens after that.
We have 3 normal beats, then a lonely P wave and some silence, then another normal beat.
This is due to parts of the AV node not resetting (or “re-polarizing”) quickly enough, meaning that the P wave is occasionally “unheard” by the rest of the heart. The AV node isn’t passing on the message.
This is another issue we could identify with code. If we can measure all of the waves and label them, then we can also identify their absence and raise an alert to medical professionals.
EKGs: doctors spying on the heart
This is how the identification of heart problems happens. Doctors, nurses, and paramedics look at the lines on EKGs and use that to guess (with great accuracy) which part of the heart is failing.
The heart is so precise that seeing any change in voltage tells us almost everything about its function.
For a deeper dive into the electrical activity of the heart and how it relates to the size and shape of each part of the QRS complex, check out Ninja Nerd’s YouTube video on EKG Basics. Engineers will find the video more relatable than your typical EKG video.
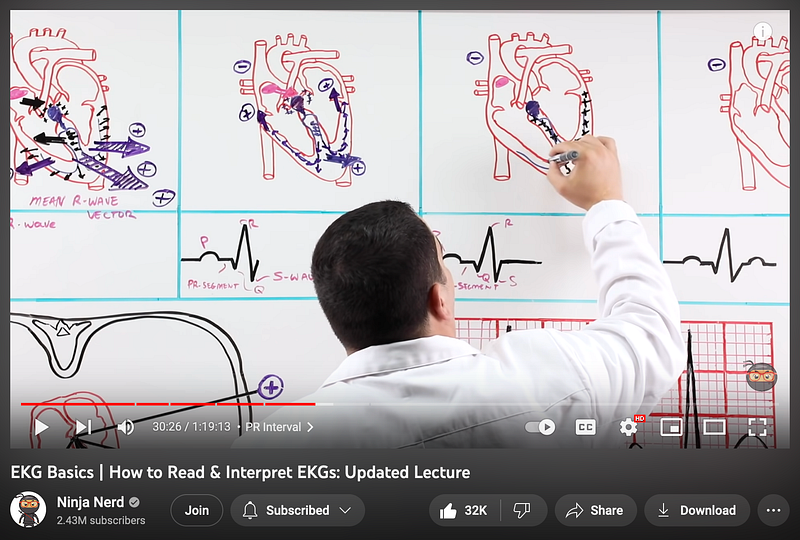
Ninja Nerd goes into each part of the EKG, including how each of the EKG wires that nurses hook you up to contributes to the overall picture of the EKG in terms of positive and negative voltage.
How to Analyze EKGs with Python: A Preview
Edit: Part 2: How to Label EKGs with Code is now available here.
This is the first part in a series about how to use Python to analyze EKG data. Here is a preview on what we’ll cover in the next articles, which will be all about the code.
We’ll use Scipy’s find_peaks() functions to label the waves then use math and other SciPy functions like peak_widths() to characterize the waves’ shapes, sizes, and distance from each other.
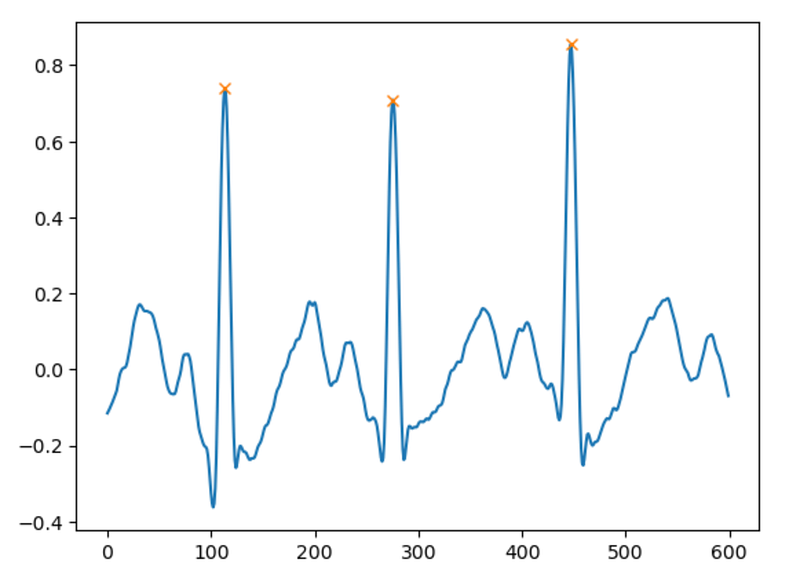
This is the simplest code for identifying R waves on an EKG:
# Load EKG data and then label everything over 1.0 mV as an R wave
import scipy
import pandas

ekg = pandas.read_csv("ekg.csv")

r_waves = scipy.signal.find_peaks(ekg, height=1.0) # 1.0 mV
This allows us to plot both the EKG and the R waves together. Each R wave is labeled with a small X at the top
With a few more lines of code, we can label the rest of the waves and get something like so:
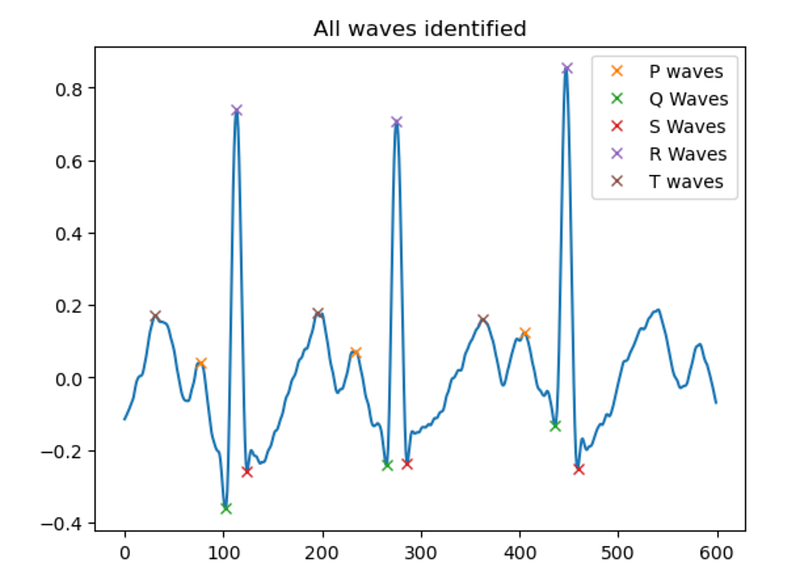
Head to Part 2 to learn how to label the waves in an EKG.
Questions and Feedback
If you have questions or feedback, email us at [email protected] or message us on Instagram (@protobioengineering).
If you liked this article, consider supporting us by donating a coffee.


