
How to Analyze Soccer Player Performance Using Data: Unveil the Stars of Tomorrow
From tracking completed passes and analyzing distance covered to delving into advanced statistical metrics, the realm of soccer data analytics is a treasure trove of knowledge waiting to be explored. In this comprehensive guide, get ready to embark on an exhilarating adventure as we equip you with the essential tools and techniques to dive into the world of soccer player performance analysis.
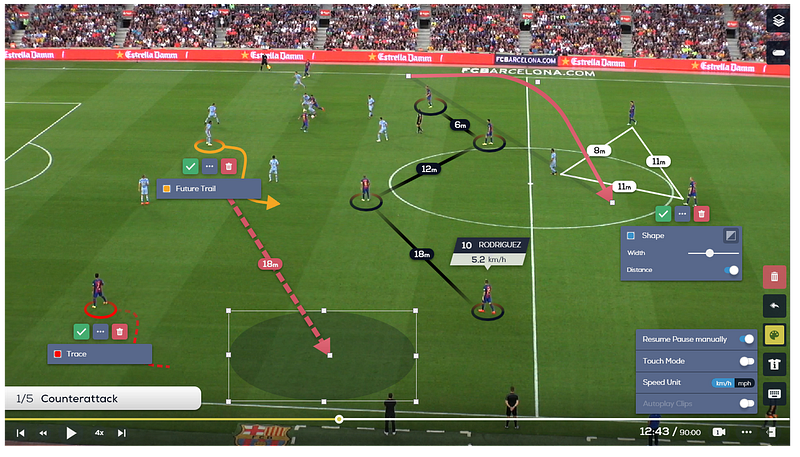
Prepare to be captivated by real-world examples and unleash the power of Python code. Whether you are an ardent soccer enthusiast, an analyst, or an aspiring data scientist, this guide will broaden your horizons and unlock the untapped potential of soccer data analysis. Together, let’s kick off this exciting journey! Soccer is more than just a game of two halves; it’s an enthralling sport that weaves together the beauty of teamwork, strategy, and sheer athleticism. But what truly makes soccer fascinating is the vast universe of data that can unveil valuable insights into player performance.
Why Data Matters in Soccer
Data analytics has taken the soccer world by storm! 📊⚽️ It’s no longer just about scouting talent or creating strategies. Now, teams use it to maximize player performance on the field, gaining insights into everything from individual stats to team dynamics. Embracing this innovative approach gives them a competitive edge in the world of soccer! 🏆🌍
Real-World Example:
Just imagine the transformative impact of data analytics on recruitment! Look no further than Liverpool FC, a prime example of harnessing the power of data-driven insights to assemble a winning team. Through their meticulous analysis of player data, they have achieved remarkable victories in the esteemed Champions League and secured the top spot in the fiercely competitive Premier League.
Their innovative approach to player recruitment has undoubtedly fueled their incredible accomplishments on and off the pitch, cementing their status as a true game-changer in the world of football. The effective utilization of data analytics has revolutionized their decision-making process, enabling them to identify the perfect players to enhance team performance and achieve unparalleled success. It’s a remarkable testament to the immense potential of data analytics in transforming the realm of sports recruitment.
Gathering Your Data
Before we dive into analyzing anything, we must have the fuel that powers it all: data. Whether it’s obtained through manual collection, publicly available datasets, or the magical realm of APIs like SportsRadar, this crucial ingredient sets the stage for insightful exploration. Let’s gather the necessary ingredients and embark on this data-driven adventure!
Code Snippet for Data Collection:
import requests
# Fetch data from an Example API
response = requests.get("https://api.sportsradar.com/soccer/player_stats")
data = response.json()
What Metrics to Analyze
Key metrics in the world of sports could encompass a wide range of game-changing factors. These factors may include goals, assists, tackles, passes, and numerous other statistics that provide valuable insights into team and player performance. Keeping track of these metrics allows teams and coaches to identify strengths, weaknesses, and areas for improvement, ultimately leading to better strategic decision-making and overall success on the field or court. By analyzing these key metrics, teams can gain a competitive edge and elevate their game to new heights.
Real-World Example:
In the thrilling realm of football, metrics like Expected Goals (xG) and Expected Assists (xA) are revolutionizing how we evaluate a player’s magical touch on the match. By quantifying the probability of scoring or making an assist based on factors like shot location and pass quality, these advanced metrics unveil a captivating narrative of a player’s performance and influence on the beautiful game we adore. Embracing these analytics unravels hidden talents, uncovers key playmakers, and grants us priceless insights into the mesmerizing world of football. Let the numbers tell their spellbinding story!
Analyzing the Data
Now, let’s get to the exciting part — crunching the numbers! We’re going to harness the incredible power of Python’s Pandas library, known for its exceptional data manipulation capabilities, to breeze through this task. With Pandas, we can effortlessly work with data structures and perform a myriad of operations, ensuring a seamless and truly magical analysis experience. So, without further ado, let’s dive right in and unlock valuable insights from our data! Get ready to be amazed by the incredible potential of Pandas!
Code Snippet for Data Analysis:
import pandas as pd

# Convert JSON to DataFrame
df = pd.DataFrame(data['players'])
# Calculate the average goals per game
avg_goals = df['goals'].sum() / df['games_played']
Visualizing the Data
Visual representation is a treasure trove in data analysis. With just a single picture, we can capture the essence of a thousand words. So, let’s dive in and plot our carefully crafted findings, creating a vibrant and captivating picture that tells a story like no other. Get ready to be amazed!
Code Snippet for Data Visualization:
import matplotlib.pyplot as plt

# Plotting average goals per game
plt.bar(df['player_name'], df['goals'] / df['games_played'])
plt.xlabel('Player Name')
plt.ylabel('Average Goals/Game')
plt.title('Average Goals Per Game by Player')
plt.show()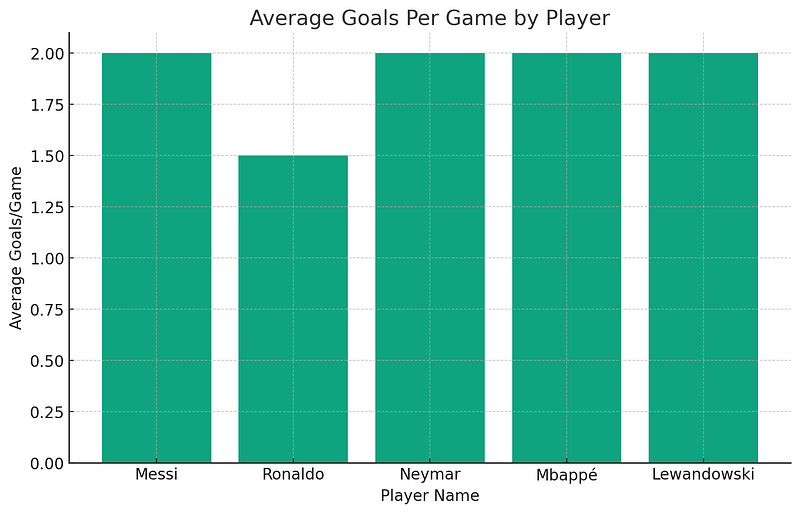
Drawing Conclusions
With the comprehensive analysis you’ve conducted, get ready to unleash actionable recommendations that drive tangible outcomes! We’re talking about recruiting fresh talent, optimizing existing strategies, and maximizing efficiency and effectiveness. By leveraging valuable insights from meticulous data analysis, you’ll establish a solid and robust foundation to smash your goals and objectives! Let’s make things happen! 💪🚀
Real-World Example:
FC Barcelona, a powerhouse in the world of football, has built a reputation for its ingenious talent-scouting strategies. By harnessing cutting-edge data analysis techniques, the club meticulously uncovers promising young talents from the renowned La Masia Academy. This meticulous approach has unearthed exceptional players like the legendary Lionel Messi, propelling the club to unparalleled heights of success. Get ready to witness football brilliance like never before!
Conclusion
Data analytics is revolutionizing the game of soccer, transforming everything from boardroom strategies to on-field performance. By harnessing these powerful techniques and tools, you have the opportunity to actively shape and influence the soccer landscape, transcending the role of a mere spectator to become a true game-changer in this ever-evolving world of soccer. Get ready to make your mark! ⚽🔥
Let’s Connect!
Hey, I’m Dave, the guy behind all this content. I’m based in Dublin and have a background in consulting and software development. When I’m not buried in code or helping businesses optimize their processes, you can find me on the soccer field, diving into rugby analytics, or crunching data science problems. I’m also a huge American Football fan. Yep, it’s an eclectic mix!
I started this blog to share insights, tips, and tricks that can make your professional journey a little bit easier. Whether you’re a seasoned pro or a newcomer to the tech world, I believe there’s always something new to learn.
Want to Collaborate or Just Chat?
- Feel free to check out my website
- Catch me on Twitter or Instagram where I share daily insights and have some fun discussions.
- You can also connect with me on LinkedIn.
If you found this article useful, don’t forget to share it and tag me. I’d love to hear your thoughts, questions, or what you’d like to see covered next!