
START GUIDE
How to ace Exploratory Data Analysis
Exploratory Data Analysis (EDA) is the primary building block of any data-centric project. This article focuses on graphical and numerical ways of performing EDA using Python libraries such as Pandas, Seaborn, Tensorflow data validator, and Lux.
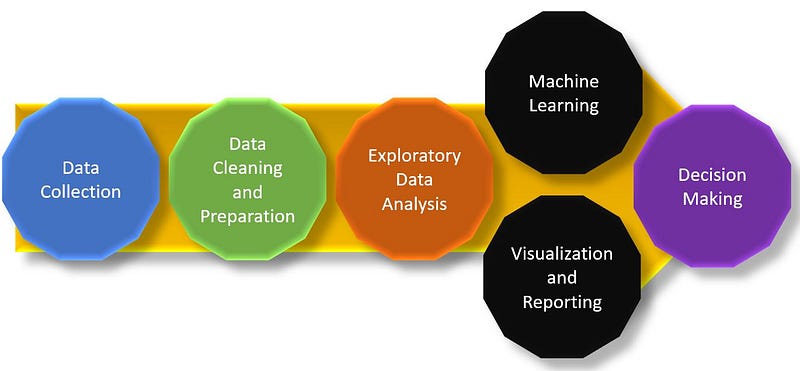
Data Scientists widely use EDA to understand datasets for decision-making and data cleaning processes. EDA reveals crucial information about the data, such as hidden patterns, outliers, variance, covariance, correlations between features. The information is essential for the hypothesis’s design and creating better-performing models.
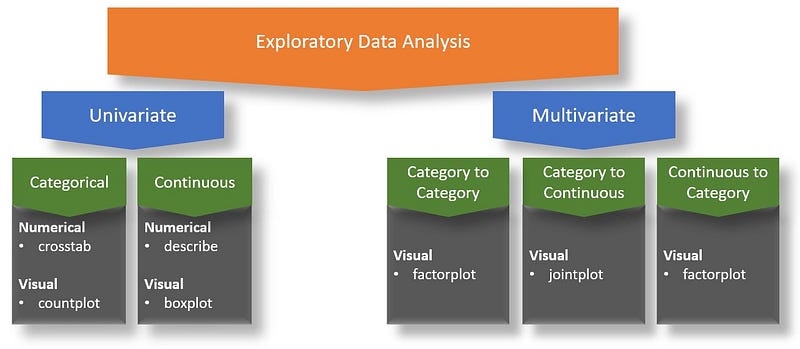
Generally, EDA falls into two categories:
- The univariate analysis involves analyzing one feature, such as summarizing and finding the feature patterns.
- The multivariate analysis technique shows the relationship between two or more features using cross-tabulation or statistics.
The figure below shows the further subdivision of EDA based on data to analyze and methods such as numerical or graphical methods.
This article covers various ways of performing EDA using the Titanic dataset taken from Kaggle.
Getting data
The Titanic dataset is downloaded from Kaggle to local drive and then loaded into pandas DataFrame using read_csv() method.

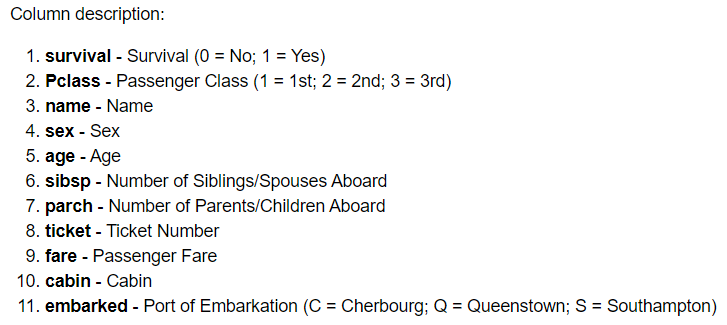
The dataset consists of 11 columns. Following shows the dataset column information below:
Data cleaning and manipulation
In this step of the process, the main focus is on data cleaning and data manipulation. For any data-centric project, data reliability is of high importance. A reliable dataset has 5 essential features:

Data cleaning and manipulation focus on handling the missing value and converting categorical features to numeric. It leads to a reliable dataset that is ready for EDA.
Handling missing data:
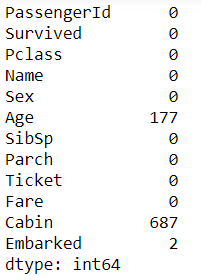
The first step is to get the information on columns that have missing data.
1. Handling Age column null value
There are two ways to handle missing values in the Age column:
- Replacing the null value of Age by mean.
- Considering Sex and Pclass columns, replace the age column's missing value with the mean based on sub-groups.
2. Handling Cabin column null value
In this case, the missing value is replaced with X.
3. Handling Embarked column null value
There are two ways to handle missing values in the Embarked column:
- Dropping null values.
- Since the missing value is from 1st class passengers, replace unknown with the place where maximum passengers boarded in first class. (Most people boarded from S.)
4. Feature manipulation
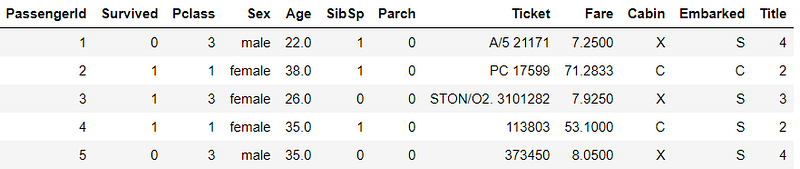
There are two columns, Name, and Cabin, in the dataset. The idea behind this section is to extract meaningful information from these columns.
Exploratory Data Analysis (EDA)
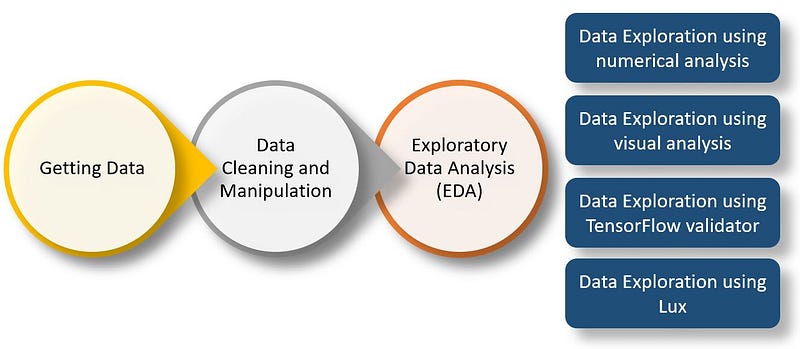
Once the dataset is cleaned, now it is an excellent time to start EDA. This section shows 4 ways of performing EDA.
1. Data exploration using numerical analysis
Pandas is the most widely used data analysis library. It offers various functions which can provide more information about the dataset with few lines of code.
The info() function of pandas offers some basic information such as the number of columns in the dataset, the data type of columns, column names, and the number of rows in the dataset.
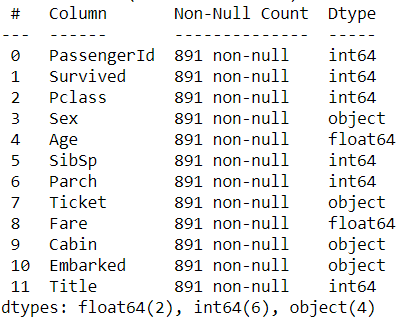
The dataset contains 11 columns.
- Features: {PassengerId , Pclass, Name, …… , Cabin, Embarked}
- Target: Survived
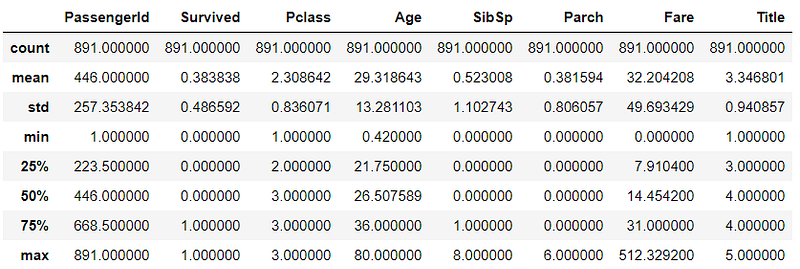
The describe() function of pandas gives vital statistics about numeric columns such as minimum, maximum, mean, and dataset distribution.
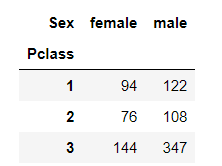
The crosstab() function of pandas offers analysis for categorical features. This case shows the number of female and male passengers (gender) traveling based on class.
Now, it’s time for getting some important questions answered, such as
How many passengers survived?
38.4% survived
- 61.6% of passengers from the given dataset didn’t survive
- 38.4% of passengers from the given dataset did survive
Is there any difference in the survival rate based on gender?
This question can be subdivided into 2, such as
- What is the percentage of female passengers who survived?
Female passengers survived: 74.2%
- What is the percentage of male passengers who survived?
Male passengers survived: 18.9%
What is the survival rate based on class?
Class 1st passenger survival rate was more comparison to 2nd and 3rd class passengers. Note: Please keep in mind this is the comparison within a group, not with the total population.
What about the survival rate of passengers based on title?
The survival rate of females from the 1st, 2nd, and 3rd category is more than others.
Similarly, many other questions can be using pandas. Now, let’s switch to visualization techniques which is more exciting.
2. Data exploration using visual analysis
Visual analysis is a creative way of getting crucial information from the dataset. In this article seaborn library is used for visual analysis.
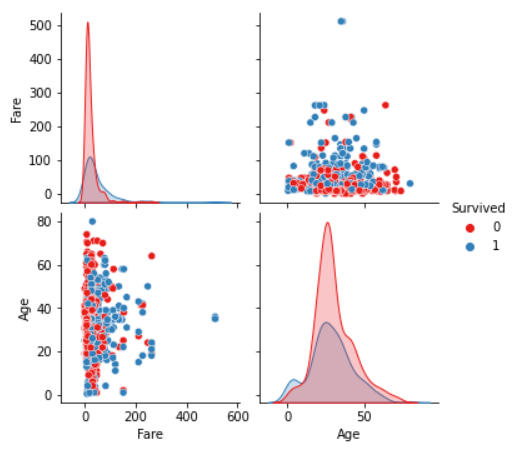
Pairplot
Use pairplot to have an insight about numeric columns are related and their distribution.
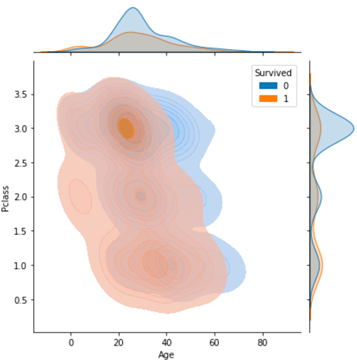
Jointplot
Jointplot to find the distribution of passengers age traveling in different class color-coded based on survival rate
Boxplot
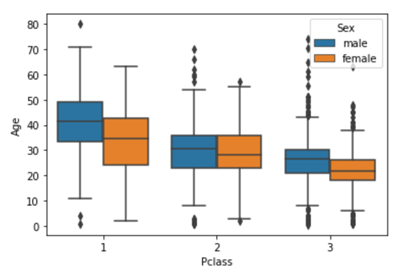
Boxplot is used to compare the age of passengers traveling in a different class based on gender.
Histogram
A histogram plot below shows the survival based on the title.
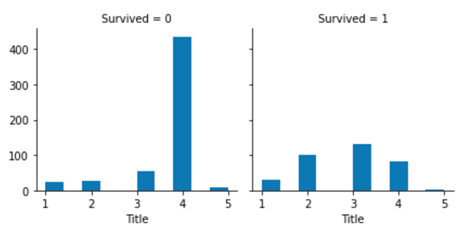
The number on the x-axis represents:
- Lady, Master, The Countess, Jonkheer, Sir, Don, Dr.
- Mrs, Mme
- Miss, Mlle, Ms
- Mr
- Capt, Col, Major, Rev
The number in the survived column represents:
0 = Not Survived, 1 = Survived
KDE plot
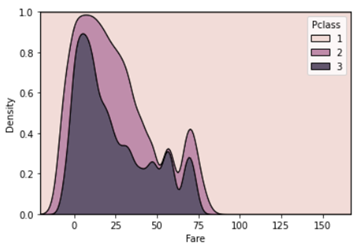
KDE plot shows the normalized stacked distribution at each fare price in the grid based on passenger class.
Scatter plot
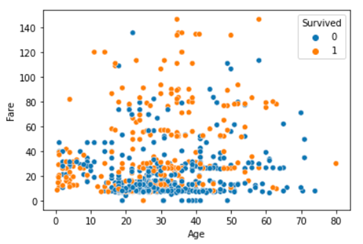
Scatter plot to show Age vs. Fare based on survival.
Count plot
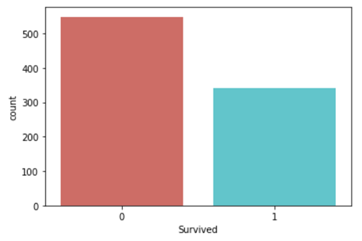
Count plot to show the number of passengers in the dataset who survived or did not survive.
3. Data exploration using Tensorflow data validator
Tensorflow data validator offers a quick solution for a lengthy EDA process done with pandas and visualization shown above. Without writing much code, one can get information such as missing values, data type, data distribution, and much more.
Tensorflow data validator is not limited to data visualization, but also it is helpful in the following scenarios:
- Validating new data during inference against bad features
- Validating if there exists any drift in the data during inference
- Validating data transformation
4. Data exploration using Lux
Lux is an even more powerful tool that offers interactive data visualization and also offers recommendations for EDA. Although it is relatively new but has a great
That’s it.
This article has shown different ways to perform Exploratory data analysis.
I hope you enjoyed this article. Any questions? Have I missed something? Please reach out on my LinkedIn or Twitter.
Follow this Github link to access all the resources used for this article.
Cheers!
Rahul


