
How My Fantastic Couples Personal Finance Spreadsheet System Helps Me Save Money
Personal finance is a critical aspect of our lives. Effectively managing personal finances is essential to achieving financial stability and success. A personal finance spreadsheet is one of the most powerful tools for managing your finances. A personal finance spreadsheet provides a clear and concise view of your finances. By tracking your income, expenses, debts, and investments, you can see exactly where your money is going and identify areas where you can improve your financial situation. Tracking can help you make better financial decisions and achieve your financial goals more quickly and easily.
They Taught Me, What?
Managing my finances has gone through so many different iterations I’ve lost count. When I was but a teenager in the 1990s, adults taught me the value of balancing one’s checkbook back when everyone was still writing checks.
Then, the digital world caught up. Balancing a checkbook was no longer needed. However, being able to track our income, expenses, goals, and investments stayed.
I have tried many recommended templates and apps, thinking they were somehow better than what I could do. Most of the time, I found these so-called professionally created personal finance templates more complicated than needed and not serving my specific needs.
As I kept tweaking and updating how I tracked my finances via a spreadsheet, I adopted some hybrid connections with apps like Monarch and a Notion project board.
On Notion and Monarch
Notion helped me create additional ways to visualize my finances and personal financial planning. But I will dive more into that in a later blog post.
I will also review my experience with the Monarch app. I find tools like Monarch, which connect to my account and attempt to automate based on my account activity, helping to ensure I’m getting everything. However, there’s a tendency for these apps to pigeonhole one in a corner on how to manage finances — in addition, bugs where accounts need to update as promised, therefore showing an inaccurate picture of my personal finances. I’ll write more about my experience with Monarch in another blog post.
Anyway, I have decided to share what I put together because I have wondered if others need something similar to what I have created. Can’t I be the only one?
What Personal Finance is to Me
Personal finance is divided into a series of different periods and ever-shifting goals. When one goal is complete, another goal should take its place. Unless you are Jeff Bezos or Warren Buffet, everyone should treat their finance as something never settled. With personal finance, you need to always prepare for the worst, no matter what. Even then, assume the worst will happen. If the worst doesn’t happen, then good! You move and put whatever extra you have in savings or investments. It’s the nature of the beast.
In a capitalistic society like most of the Western world, especially in a country like mine (the United States), you must always be ready since most things are uncertain and not given. If health services were a given and retirement were not beholden to a stock market, which most often is advantageous to a few — — then most of what I do might not be needed. But that is not my reality today and is not valid for many others.
But first, let me break it down.
Pay Periods
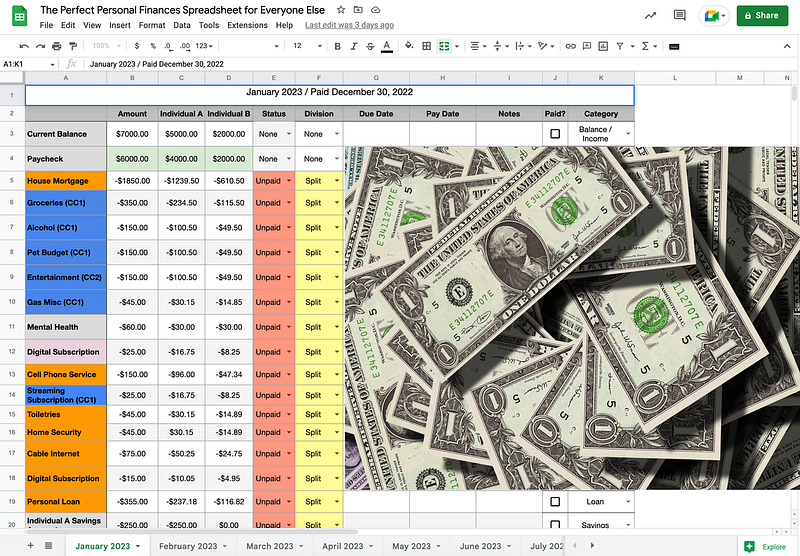
I divided my spreadsheet by pay periods.
I’ve been paid bi-monthly (twice a month) for most of my adult professional life. Therefore, each sheet has two tables dedicated to when I get paid, and each sheet focuses on one month.
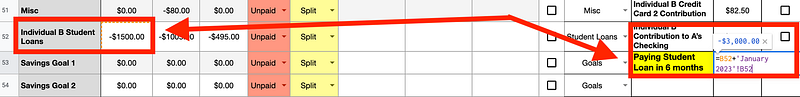
If I have a goal, I apply that accordingly.
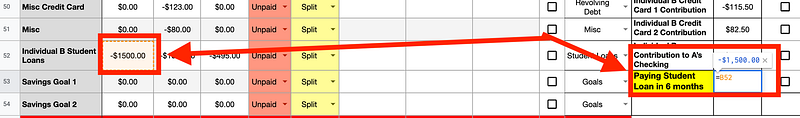
For example, I’m trying to pay off student loans by the end of April this year. Therefore, I created a simple sum formula that adds up the total from when I first contributed to that goal in January to when I completed that goal in April.
Not Tracking 401K
I don’t keep track of my 401K investments since my employer’s HR and accounting departments automatically deduct them from my paycheck. My employer matches my 401K contribution, which isn’t considered part of my taxable income.
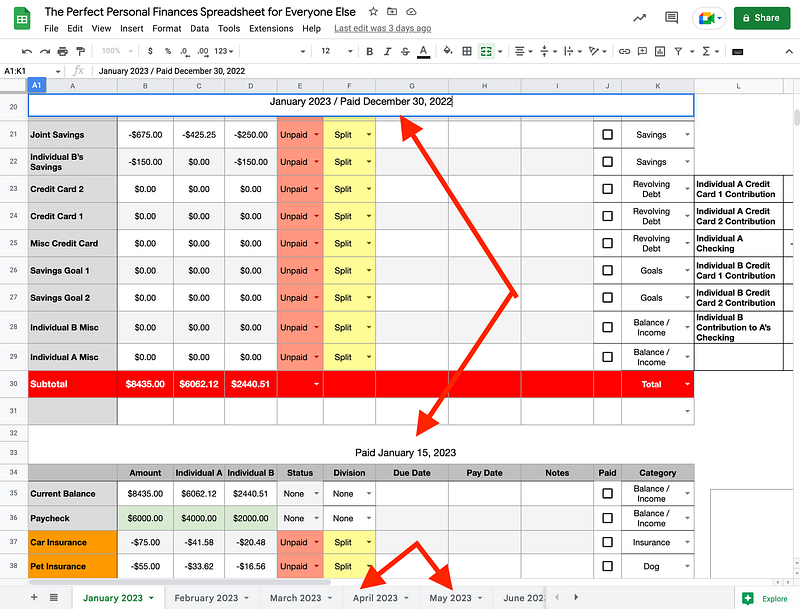
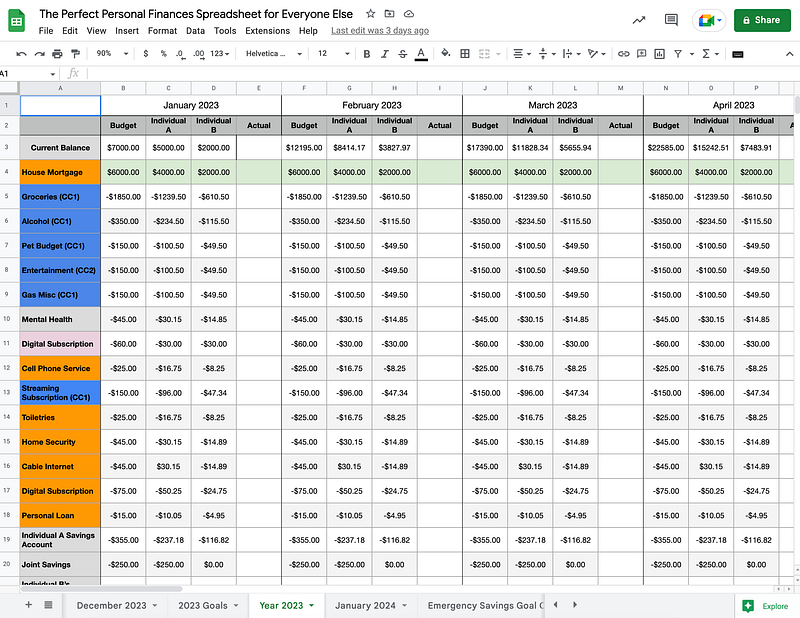
My spreadsheet assumes two incomes sharing financial responsibility and tracks both contributing individuals’ net income (income after taxes).
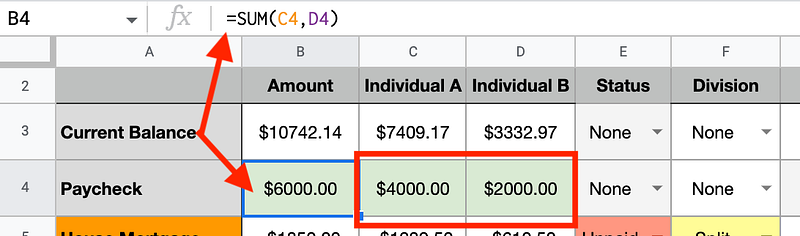
In my spreadsheet, individual A has volunteered their checking account to pay some expenses. Individual B sends money to individual A every month. A simple sum formula helps identify the total amount to give to individual A every pay period.
Percentage Based on Income
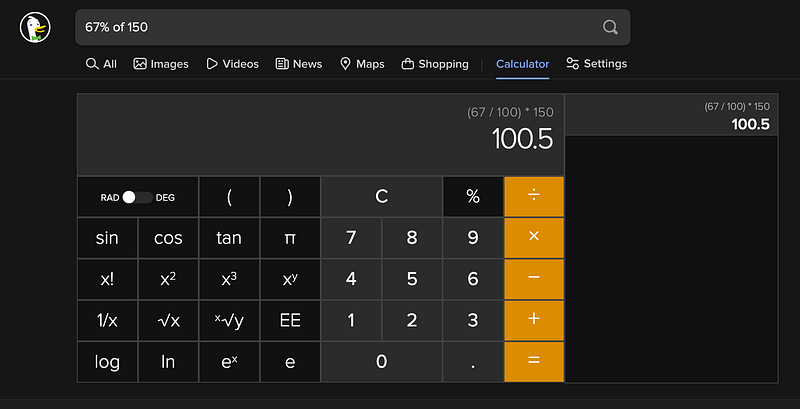
The expense responsibility is divided by income share, for example. Suppose individual A contributes 67% of the combined income of A and B. In that case, that is represented in how the division of the expenses. This is a more honest and fair way to approach sharing expenses.
Individual A will always contribute 67% when dividing goals and expenses, while individual B will contribute 33%. It’s fair and balanced. The only time the division changes are when income level changes, for example.
I have a few things in my spreadsheet which might seem redundant, but the method to my madness is to serve the purpose of a two-income household.
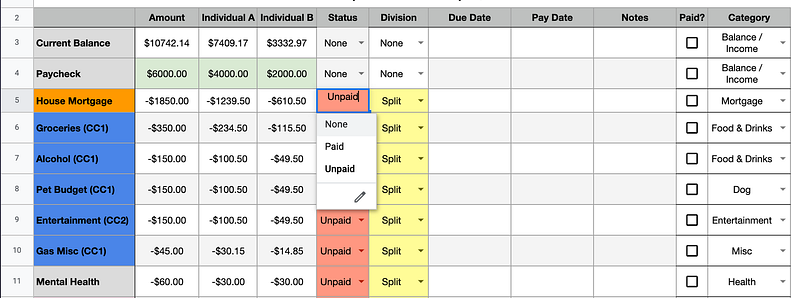
Each table has a dropdown for None, Unpaid, and Paid on the spreadsheet. I use this dropdown when the actual balance is paid, regardless if it’s A or B. When both fully contributed to said expense, the “Paid” checkbox is checked.
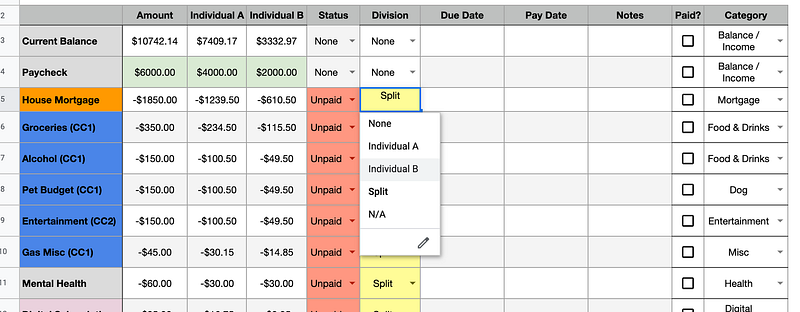
There is also a dropdown based on how the expenses are paid (Individual A, Individual B, or Split). I like color in my spreadsheets. I created a filter that updates the color of this cell based on what is (Individual A, Individual B, or Split) is chosen.
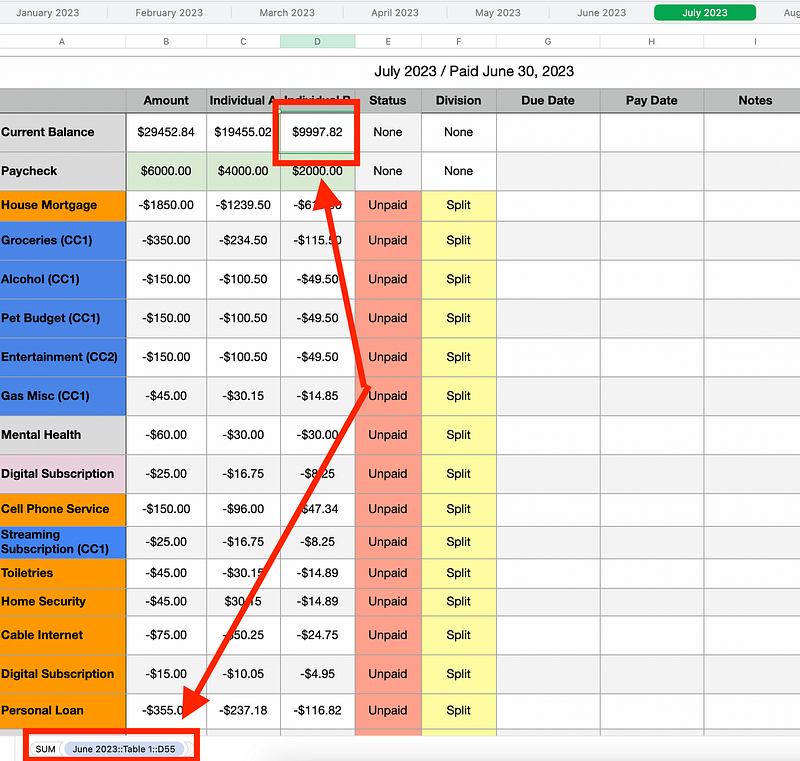
Forecasting
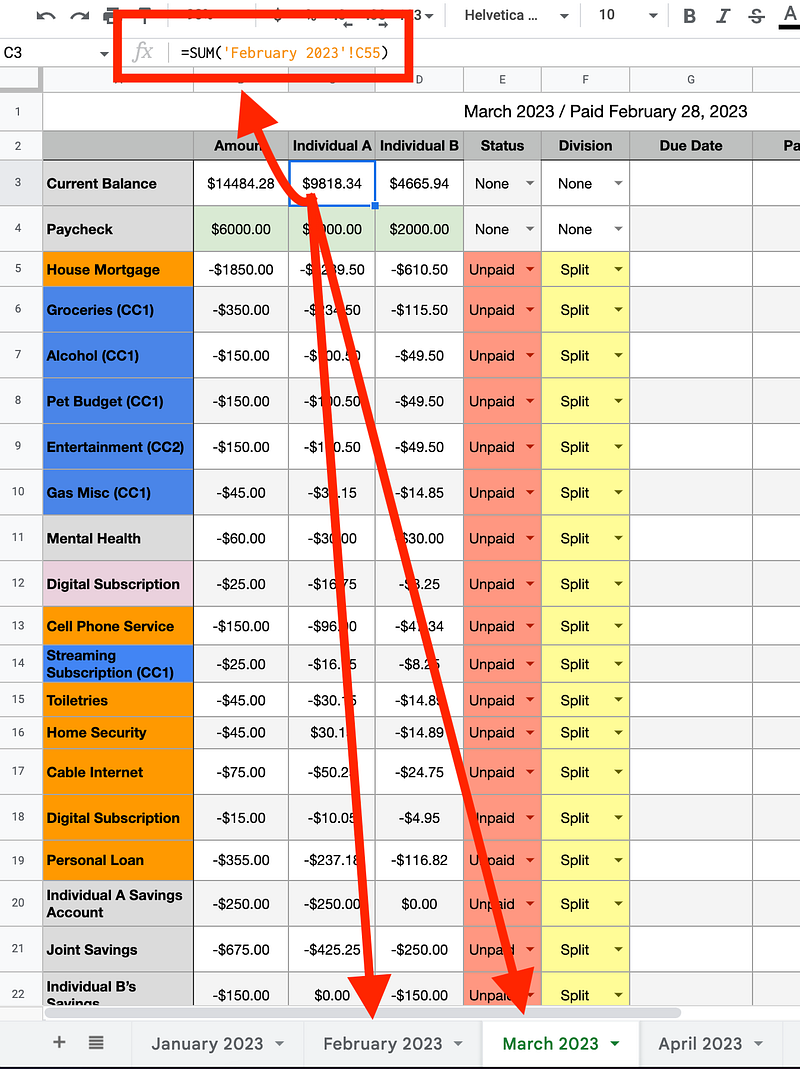
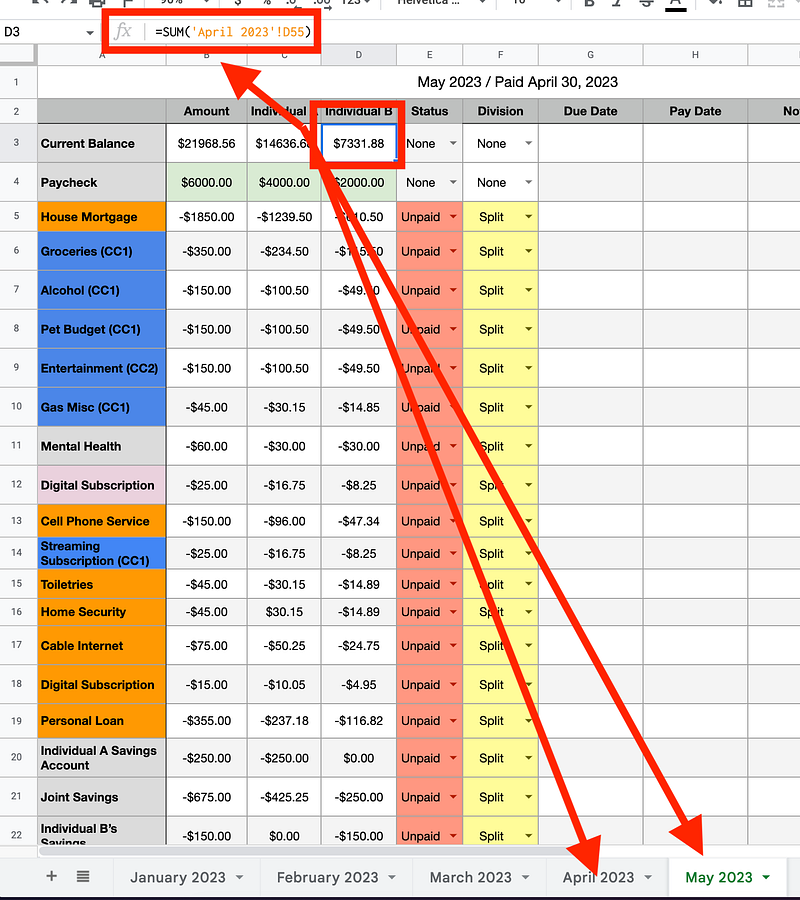
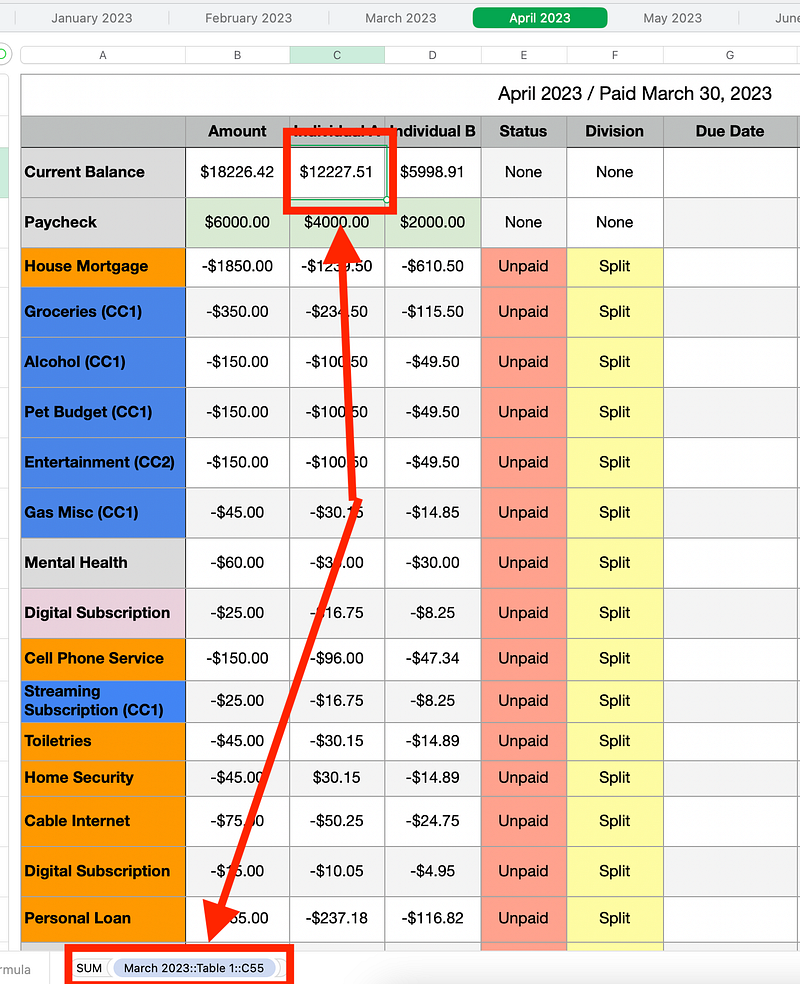
Another essential feature of my spreadsheet is forecasting. I have built my spreadsheet to continue the balance from a previous pay period to the next. But I have continued. I also created my spreadsheet so the income level carries over to the next month or sheet. This continues until the spreadsheet ends at the end of the year.
Being able to forecast like this is highly beneficial.
Here is an example of how this works with Apple Numbers:
Prioritization
For example, I went over my set budget in December. As a result, I saw how that affected some of my goals, including buying things for my house and saving up for a big vacation. I changed some plans and saw what items (if any) should be sacrificed for the year. I can prioritize and reprioritize my goals based on the fact I can forecast.
Categories
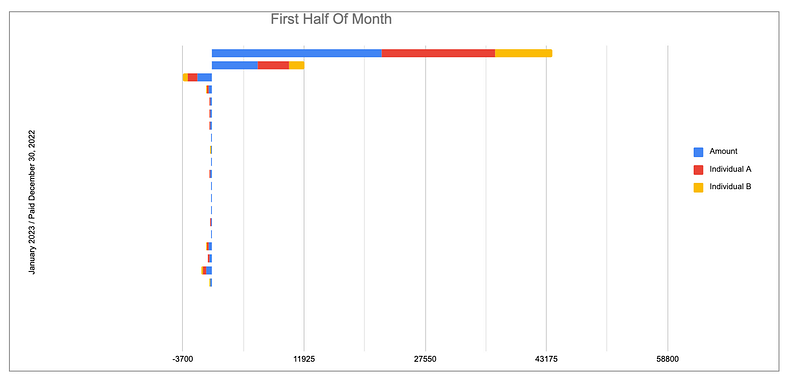
I have categories I hoped would be helpful and some charts I tried creating in my spreadsheet. Alas, the charts have not been as beneficial as I thought they would. I hardly, if ever, use the charts.
Due Date vs. Pay Date
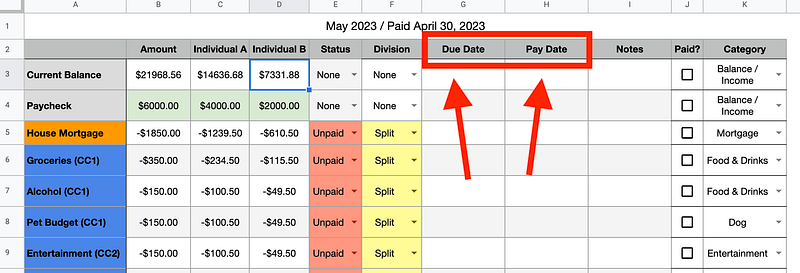
In my spreadsheet, you will see two columns:
- Due Date
- Pay Date
Due Date: Represents the day an expense is expected. This means that I need to pay the fee to avoid being late.
Pay Date: This represents the actual date I paid the expense.
Contribution
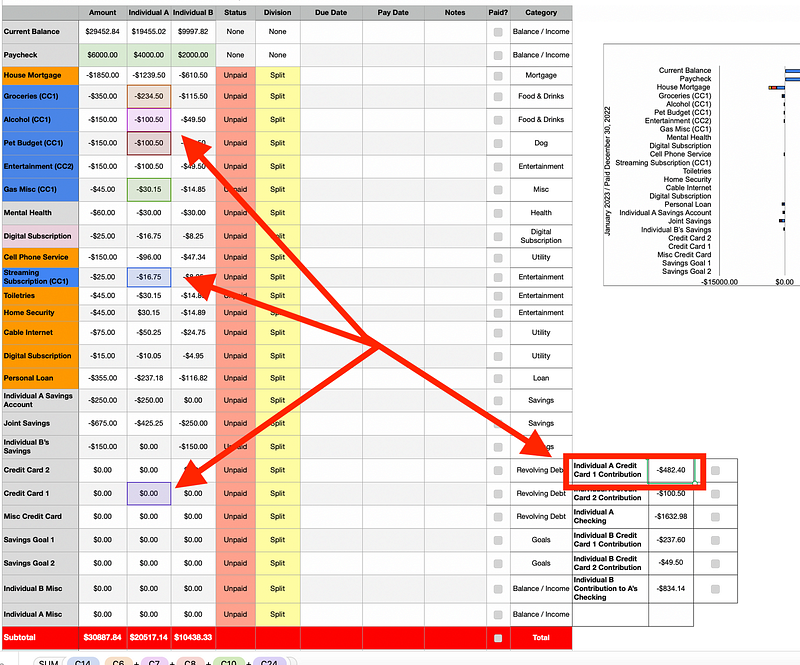
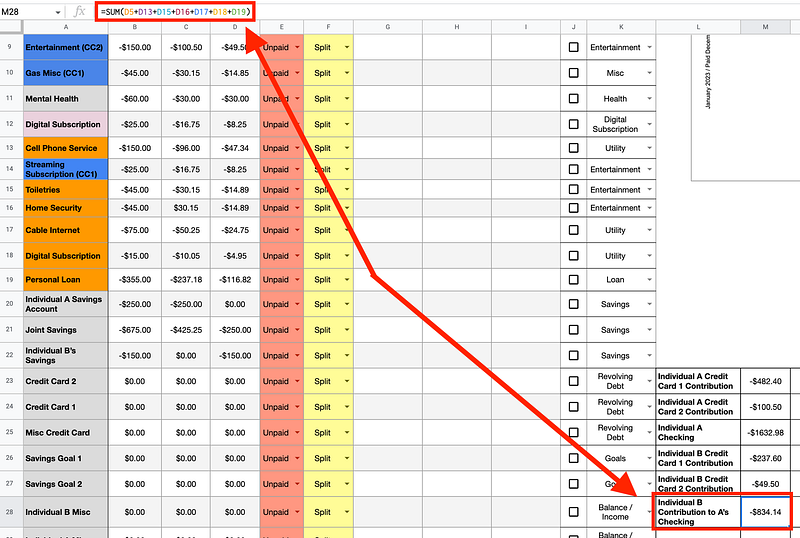
This section summarizes the reasonable expenses under each column to help quickly determine who to contribute.
For example, Individual A pays some expenses solely from their checking account. So, Individual B helps contribute their portion to help Individual A.
Another example is that groceries are handled by the Credit Card card that offers the best bonus points or cash back for buying groceries. Therefore, the column shows the expense column that contributes to each, along with anything additional that might have been charged to that Credit Card.
Notes
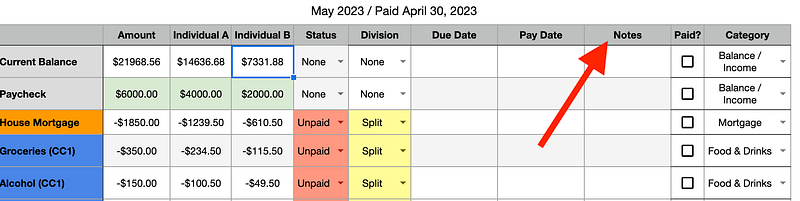
The Notes column is any misc note you need to write whenever necessary.
There you have it! The breakdown of my finance spreadsheet. It might need to be more straightforward, or it might be too simple. But it works for me. So far, I am hitting my goals, saving money, and staying organized. But note: this is not a passive tool. I habitually open my spreadsheet weekly to update and review my progress. I learned the hard way in my twenties what happens when you don’t stay on top of your finances.
Charts & Other Formulas
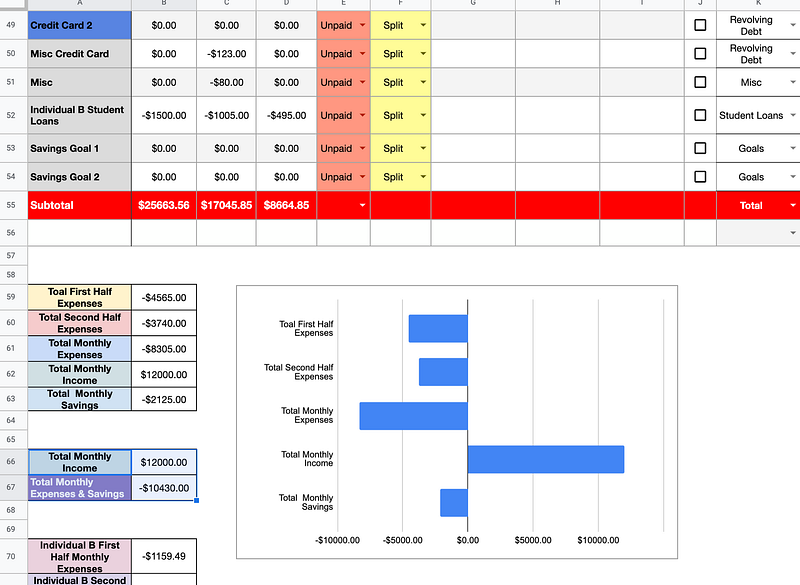
When you scroll below the two pay period tables on a month sheet, you’ll notice I have various sum formulas breaking down things such as the total expenses for a month, total income for a month, each individual’s total expense and revenue, etc.
Year View
To help forecast and provide another way to visualize my finances, I have one sheet that includes a simplified view of all months within a year, along with SUM formulas that manipulate the SUM formulas I use to carry from one month sheet to another sheet.
Handy Tools
(Year) Goals
In these sheets, I created a way to plan goals. To help plan toward a goal on a month-by-month basis, I put in a formula that divides the budgeted goal by the number of scheduled months to meet that goal. The number from that division formula tells me how much I need to allocate each month to work toward any plan I might have, like saving for a vacation, an emergency fund, a new car, etc.
Savings Goal Tracker
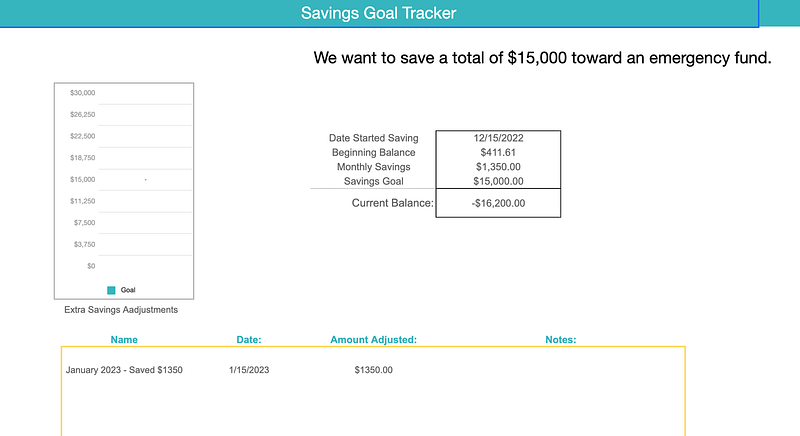
The Savings Goal Tracker is just another goal tracker. I designed the Savings Goal Tracker for you to manually add the amount you’ve contributed toward your goal in case you cannot keep the same goal each month. Sometimes we have those months where we go over what we planned.
If that happens, I will regroup and rebrand that month as a catch-up. I took fell into this trap a lot more when I wasn’t tracking my income and expenses. Nowadays, I rarely encounter a catch-up month, thanks to my spreadsheet.
Savings Percentage Tracker
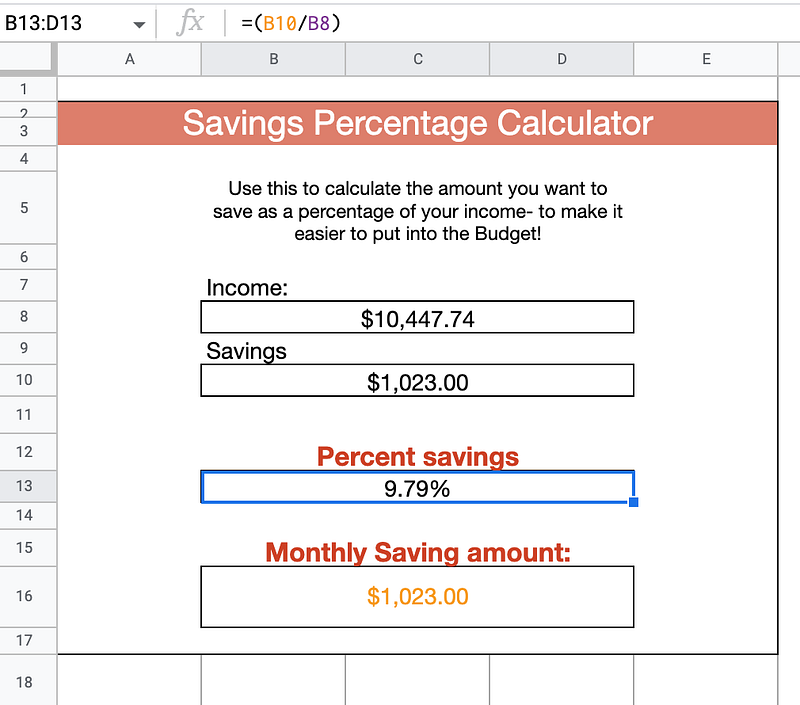
Use this to calculate the amount you want to save as a percentage of your income.
Creating a new Month
Say you’ve used my spreadsheet for a year and now used all your sheets.
To create a new month, duplicate the most recent month and rename it the month and year. Then, you must ensure the SUM formula that carries over the previous month’s end balance reflects the month you duplicated.
You should have no trouble recreating what I did in my spreadsheet by following my instructions. I prefer Apple Numbers, but I also am very familiar with Google Sheets and have used it. I switch between the two. I do not use Excel, but I provided an Excel option if you decide to purchase my spreadsheet.
Get a Copy of My Financial Spreadsheet
After reading this article, if you think what I did is helpful but want to do only some of the work yourself, you are in luck!
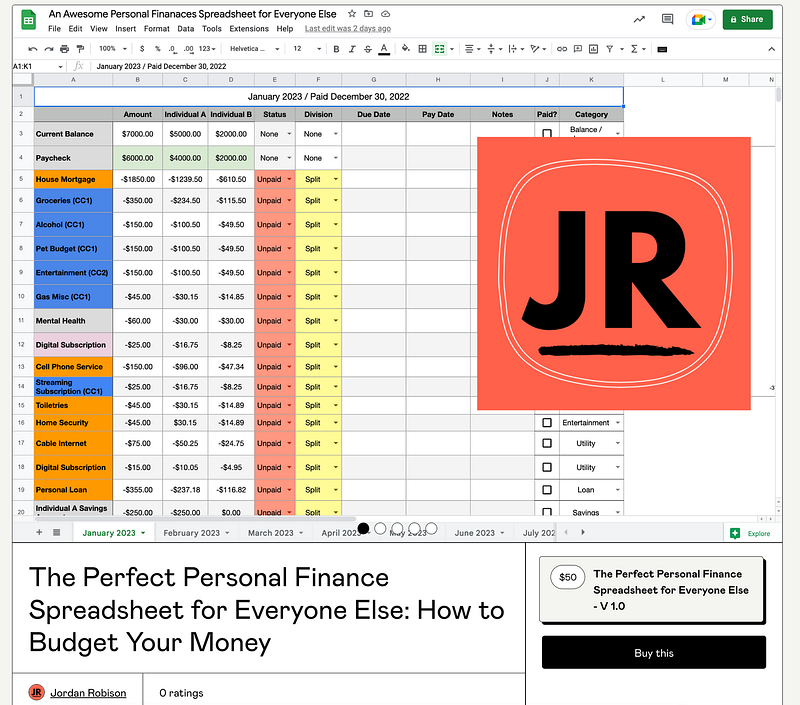
You are in luck if you prefer not to spend any of the hours building a spreadsheet as I did. I have sold my spreadsheet below. I spent a lot of hours tweaking and perfecting my spreadsheet. But once you purchase, you can access Apple Numbers, a Google Sheet, and an Excel version.
You can purchase my spreadsheet by simply clicking on this screenshot above or the link below: