
How Impactful are My Actions to Reduce My Carbon Footprint?

Have you ever wanted to compare the impact of your measures, reducing your carbon footprint? What saves more CO₂: using public transportation instead of your car or eating margarine instead of butter?
A good way to analyze the impact of your different CO₂ actions is to unify. That means you compute your CO₂ savings per month to make them comparable.
In this article, I provide you a detailed collection of measures to reduce your carbon footprint and their impact in terms of CO₂ equivalents per month and person. I would be glad to extend this list with your suggestions on further CO₂ reduction actions. Please let me know in the comments.
If you are interested in how to make the most out of the following collection, have a look at my article:
Food & Drinks
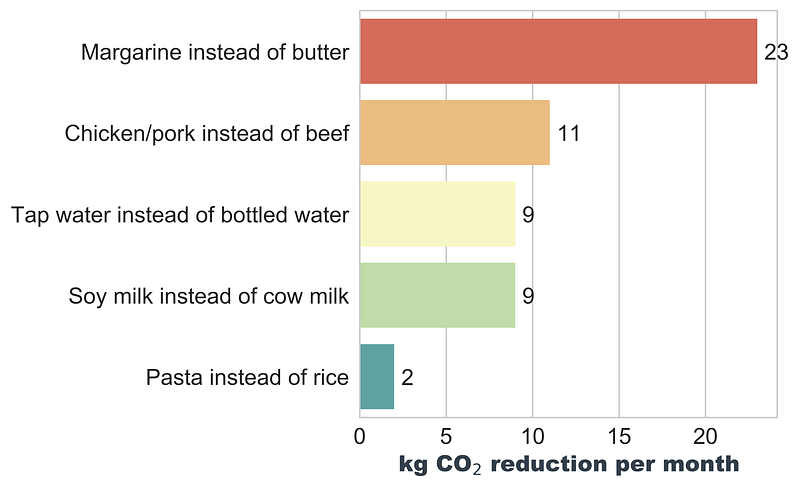
- Margarine instead of butter: 23kg CO₂ (assuming one packet (250g) per week) [1]
- Chicken/pork instead of beef: 11kg CO₂ (150g per meal, twice per week) [2]
- Tap water instead of bottled water: 9kg CO₂ (assuming 1.5l daily) [3]
- Soy milk instead of cow milk: 9kg CO₂ (assuming 2l weekly) [4]
- Pasta instead of rice: 2kg CO₂ (100g per meal, twice per week) [5]
Mobility
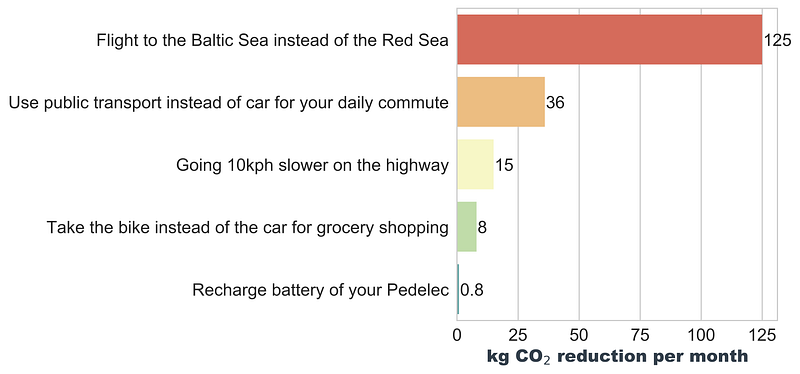
- Fly to the Baltic Sea instead of the Red Sea as your summer vacation destination: 125 kg CO₂ (1,500kg CO₂ divided by 12) [6]
- Use public transport instead of a car for your daily commute: 36kg CO₂ (15 days a month, distance 10 kilometers one way) [7]
- Going 10kph slower on the highway: 15kg CO₂ (assuming 10,000km/year on the highway) [8]
- Take the bike instead of the car for grocery shopping: 8kg CO₂ (assuming 5km distance one way, once per week) [9]
- Recharge battery of your Pedelec: 0.8kg CO₂ (assuming once a week, 500Wh capacity) [10]
Living
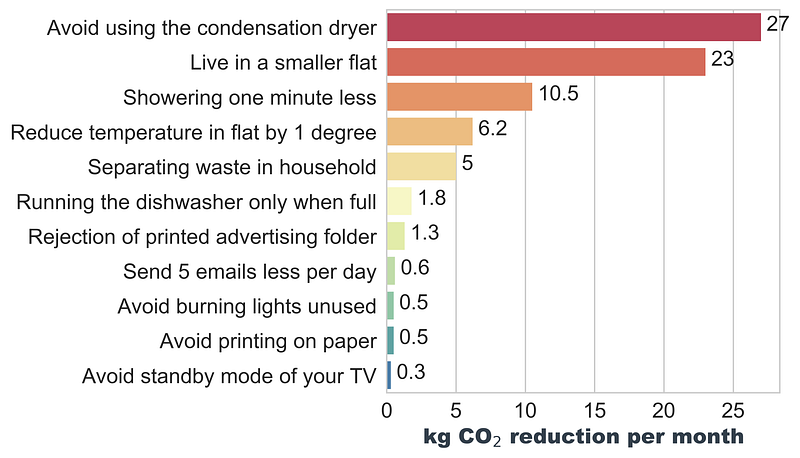
- Drying clothes outside instead of using the dryer instead: 9kg -27kg CO₂ (heat pump dryer vs. condensation dryer; running twice per week) [18]
- Live in a smaller flat: 23kg CO₂ (80 sqm instead of 100sqm, per person for a 2-person household) [11]
- Showering one minute less: 10.5kg CO₂ (assuming 15 times per month) [12]
- Reduce the temperature in the flat during the heating period by 1 degree: 6.2kg CO₂ (assuming 90sqm flat, per person for a 2-person household) [13]
- Separating waste in household: 5kg CO₂ [14]
- Running the dishwasher full once instead of half-full twice: 1.8kg CO₂ (if once per week) [15]
- Rejection of printed advertising folder: 1.3 kg CO₂ (per person for a 2-person household) [17]
- Send 5 emails less per day: 0.6kg CO₂ (without attachment) [16]
- Avoid burning lights unused: 0.5kg CO₂ (assuming 4x 5 Watt LEDs unnecessarily burning 2 hours per day) [19]
- Avoid printing on paper: 0.5kg CO₂ (for 100 sheets) [20]
- Avoid standby mode of your TV: 0.3 kg CO₂ [21]
General notes:
- All CO₂ equivalents are computed as monthly emissions of one person. For simplicity, I used 4.5 weeks per month instead of the yearly average of 4.345.
- If you have better references or deviating information, please let me know, and we can discuss adding them. As this is not a scientific article, I often did not spend the effort to search for the primary source.
- I am sorry that many of my references are written in German. Please let me know if you have English references for the same category.
- For any consumption of electric energy, I assume 400g CO₂ per kWh. This value is strongly dependent on the country you are living in. As an example, for 2016, the European Union had an average of 296g CO₂/kWh, Germany 441g CO₂ per kWh, France 59g CO₂ per kWh, and Poland 773g CO₂ per kWh (European Environment Agency).
- There are doubts that having a green energy plan has a significant impact on your personal value for CO₂ per kWh. First, green power certificates can be bought easily without the increased production of green power. Second, voluntary contributions are comparably small and have only a small impact(Verbraucherzentrale).
- Several of the assumptions are based on my personal consumption and the devices used in my household. Other consumptions or devices may vary significantly.
- When I refer to CO₂, I actually mean CO₂ equivalents. For easier reading, I used the less precise but simpler term CO₂.
Explanations & references:
[1] 1kg of butter causes CO₂ emissions of 20–25 kg according to most sources I found (e.g. Thuenen-Institut, Öko-Institut). However, some also mention 15kg (WWF) or just 9kg (Klimatarier/IFEU Institut). The CO₂ emission estimations for 1kg margarine range between 0.7kg (Thuenen-Institut) and 2kg (Klimatarier/IFEU Institut). Note: When buying margarine, you might want to look for a product not having palm oil in the ingredients. For this calculation, I used: 21 CO₂/kg for butter and 1kg CO2e/kg for margarine
[2] 1kg of beef leads to emissions between 11 kg CO₂ (lower bound of Öko-Institut) and 21 kg CO₂ (upper bound of WWF). 1kg of chicken or pork leads to between 3 kg CO₂ (lower bound of Öko-Institut) and 8 kg CO₂ (upper bound of WWF). For this calculation, I used: 12 kg CO₂/kg of beef and 4kg CO2e/kg of chicken/pork.
[3] A survey of multiple studies (Schröder et al.) reports that many estimates are in a range between 100g and 500g CO₂ per liter of bottled water. The emissions for tap water are neglectable (nachhaltig-sein.info). For this calculation, I used: 200g CO₂ per liter of bottled water and 0g CO₂ per liter of tap water.
[4] 1 liter of cow milk leads to emissions between 1 kg CO₂ and 3 kg CO₂ (Poore&Nemecek), also strongly depending on the continent you are living in. 1 liter of soy milk leads to around 1kg CO₂ (Klimatarier/IFEU Institut). For this calculation, I used: 2kg CO₂/liter of cow milk and 1kg CO2e/liter of soy milk.
[5] 1kg of rice leads to emissions between 3kg CO₂ (Klimatarier/IFEU Institut) and 6kg CO₂ (WWF). 1kg of pasta leads to 0.5kg CO₂ (Klimatarier/IFEU Institut). For this calculation, I used: 4.5kg CO₂/kg of rice and 0.5kg CO2e/kg of pasta.
[6] Calculated on atmosfair.de (round-trips): Cologne (GER) - Rostock(GER): 311kg CO₂; Cologne(GER)-Hurghada (Egypt): 1,803 kg CO₂
[7] In 2018, licensed cars in Germany needed 7.8 liters of gasoline or 7 liters of diesel per 100km on average (de.statista.com). Burning gasoline leads to 2.37 kg CO2 per liter, diesel to 2,65 kg CO₂ per liter (helmholtz.de). Thus, there is an average emission of 185g CO₂ per km on both gasoline or diesel. umweltbundesamt.de reports even 220g CO₂ per km (considering their average number of passengers). Cars in the UK have between 173 and 180g CO₂ per km (bbc.com), cars in the US even 250 g CO₂ per km (epa.gov). Local public transport in Germany causes 57g CO₂ per km and per passenger (umweltbundesamt.de). For my calculation, I used a difference of 120 g CO₂ per km between both modes of transportation, assuming only one passenger in the car.
[8] Gas consumption increases by 50% when driving 160kph instead of 120kph, mainly due to aerodynamic drag (Ploetz et al.). According to theguardian.com, cruising at 70mph (113kph) instead of 80mph (129kph) leads to a fuel reduction of 10%. For my calculation, I assumed 180g CO₂ per km (see [7]). Also, I assumed a decreased consumption of 10% when going 10kph slower. (Of course, this is a strong simplification neglecting the driving speed).
[9] see [7]
[10] No transmission losses are considered. I assumed 400g CO₂ per kWh.
[11] 14 m³ of gas per year and m² of the apartment (energiesparen-im-haushalt.de/) and 2kg CO₂ per m³ of gas (klimaneutral-handeln.de) lead to 28kg CO₂ per m² and year or 2.3kg CO₂ per m² and month. Of course, these values strongly depend on the condition of your apartment and the type of your heater.
[12] Based on [11], the emissions for a 90m² flat are 207 kg CO₂ per month. A reduction of the temperature in your flat by one degree Celsius leads to savings of about 6% (test.de).
[13] A 3-minute hot shower with a regular showerhead leads to 2.9 kg CO₂ according to sueddeutsche.de. However, dw.com reports that 12 minutes of showering lead to 1kg CO₂. For computing the monthly impact, I used 0.7 kg CO₂ per minute showering.
[14] 3.1 million tons of CO₂ per year in Germany (kommunalwirtschaft.eu) ( →48kg CO₂ per person and year, if 80% of inhabitants contribute), 500.000 tons of CO₂ per year in Austria (ara.at) ( →71kg CO₂ per person and year, if 80% of inhabitants contribute). For computing the monthly impact, I used 60kg CO₂ per person per year.
[15] A run of a modern dishwasher causes less than 1 kWh and thus 400g CO₂ (umweltbundesamt.de).
[16] Estimations range between 1g (zdf.de) and 10g (oekotest.de) per email. I assumed 4g per email → 30 days * 5 emails / day * 4 g = 0.6kg CO₂
[17] 30kg CO₂ per year according to geo.de
[18] Efficient heat pump dryers need less than 2kWh per run (e.g. bosch-home.com). I assumed 1kg CO₂ per run being pessimistic about these manufacturer numbers. Traditional dryers cause around 3kg CO₂ per run (test.de) The construction of a dryer has estimated emissions of 209 kg CO₂ (ecotopten.de). With an estimated lifetime of 12 years, the monthly CO₂ impact is around 1.5 kg CO₂. I neglected this additional impact as this would imply the general decision of buying a dryer or not.
[19] 20W *2h/day *30days*400g/kWh = 0.48 kg CO₂
[20] 500 sheets of paper lead to 2.2–2.6kg CO₂ according to papiernetz.de For this calculation, I used: 2.5kg CO₂ per 500 sheets
[21] Modern TVs need around 1 Watt in standby mode (test.de) 1W*24h*30days*400g/kWh=0.288kg CO2