
How I Used Machine Learning To Organise Football Matches
Explaining how machine learning models can be used in day to day tasks
Machine learning is gaining popularity and many firms are adopting it in their decision-making process. But can we use it to help with our daily tasks? I put this question to test and machine learning turned out to be very helpful. Let me explain.
I will take this opportunity to also explain machine learning from the foundation up because it’s one area that every professional need to be familiar with.

Let’s start!
We had a great summer this year. It was the first of May and I decided to organise a football match with my friends. So I phoned a nearby sports center to query the cost of booking a football pitch for 1 hour for the first weekend of June. The sports center asked me to pay the full cost and book it in advance due to the high demand. Pre-book(?) I asked. But I don’t know how many of my friends (if any) will play the football match? Well, can you not, maybe, guess or predict? They asked!
Hold on! Predict? Machine learning can do that! It can be great at forecasting.
So I asked myself, is there a way to predict how many of my friends would be interested in playing football? Can we use machine learning algorithm to group my friends into two categories of “Interested” and “Not Interested”. That’s where machine learning comes to rescue as it can do just that! Let me explain.
Article Aim
In this article:
- I will briefly explain what machine learning is and its basic three techniques
- I will explain how we can gather data and feed it to a model along with the common data science steps
- Along the way, I will present the python code which I am going to use to classify my friends into the appropriate groups or categories.
I will also explain the concepts so that all of us can understand why we do things the way we do in a machine learning project.
This article will provide you an end-to-end view of a machine learning project from start to its completion.
For the ones amongst us who are new to the buzz word of machine learning, let me give a quick overview!
1. What Is A Machine Learning Model?
Machine learning is a field of artificial intelligence.
In a nutshell, it revolves around the concept of feeding lots of data to an algorithm (call it a model) so that the model can learn the patterns of the data and subsequently train itself. We can then use the trained model to forecast data that it has not seen before. So, machine learning is about getting machines to learn from the data.

2. Data Preparation
For the problem that I am trying to solve, I need to gather some data. This is where data science comes in and it is occasionally the first step in a machine learning project.
What sort of data would I need and how do I decide whether a friend of mine would be interested?
Well, I am trying to categorise my friends into two groups. The first task is to understand the factors that the category is dependent on. Let me elaborate!
- I was planning to invite my friends via WhatsApp so the first answer to investigate is whether my friends are active on WhatsApp. The active friends are more likely to view my invitation.
- Their age and the area they live in matters too. And also, it’s vital to record whether we have played a football match before and whether they play football on a regular basis. The answer to these variables will also help me with categorising my friends into the appropriate categories.
- What else? Well, I can also record whether wehave met each other in the last 3 months? The area they live in can also determine whether it would be feasible for them to come. As I was planning to organise the match on the first weekend of June, I should also estimate whether they are usually free on weekends and are available in June. Some of it was guesswork!
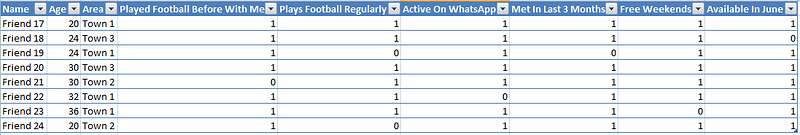
Ok, that’s how we gather data. Therefore, I created a csv file with the following columns:
- Name (this is just for me to identify them)
- Age
- Area
- Played Football Before With Me
- Plays Football Regularly
- Active On WhatsApp
- Met In Last 3 Months
- Free Weekends
- Available In June
Most of the labels are self-explanatory. My initial intuition is based on the assumption that these factors will influence the decision criteria on whether they will be interested in playing the football match.
For boolean fields (True/False), I used 1 to represent True and 0 to represent False.
3. Python Code — Stage 1
I used python to implement the solution.
3.1 Preparing Environment
Importing Libraries
The first task is to import the libraries we need:
import pandas as pd
from sklearn.preprocessing import LabelEncoder
from sklearn.cluster import KMeans
import numpy as np
import matplotlib.pyplot as pl
Loading Data Into DataFrame
Next task is to load the data
#Read File
train = pd.read_csv(r"football\TrainFootballEvent.csv")
One of the important task in data science is to encode categorical values to numerical values
3.2 Data Science Steps
Encoding Data
Not all of the data can be presented as numbers in our data set. To elaborate, the area, where my friend lives in, is represented as text fields. For textual fields, we can use label encoders to convert text to numbers:
#Encoding Categorical To Numerical Values
labelEncoder = LabelEncoder()
labelEncoder.fit(train['Area'])
train['Area'] = labelEncoder.transform(train['Area'])
Fill Missing Data
At times, we get the issue of missing data in our data set. To fill missing data, we have multiple options, including:
- Use machine learning algorithms to generate missing data
- Provide default values
- Use historic values
- Calculate missing data such as by using mean, median, max, min to fill missing data
When I can’t figure out whether my friends are active on Whatsapp, I defaulted the empty values to “False”:
# Fill missing values
train.fillna("0", inplace=True)
Data manipulation
Finally, we often have to change the data. For example, I am calculating the inverse of age because my assumption is that it is more likely for my younger friends to join me on a football match.
#lower age, more likely they will be interested to play
train['Age'] = train["Age"].apply(lambda x: (1/x))
Drop the text columns: Name
#drop Name column from the data
X = train.drop(['Name'], 1).astype(float).values
3. Choosing A Machine Learning Algorithm
Now our data is ready. Our next task is to choose a machine learning algorithm. We all know that there are a large number of machine learning models available (potentially 100s).
Can we group the machine learning models into different groups?
Yes. We can categorise the machine learning algorithms into three main groups:
- Supervised: These algorithms require us to feed them with the right answers along with the data so that they can understand the patterns of the data and work out how they need to calculate the correct answer themselves.
- Unsupervised: These algorithms do not expect us to feed them the correct answers for the data, they can work out the answers themselves. These algorithms are good for grouping data into appropriate clusters. For example, we can use the algorithms to find if they can spot trends and patterns in complex data and group them appropriately. That’s what I need.
- Reinforcement learning: These are feedback/interactions based learning algorithms. Essentially, these algorithms perform an action and assess whether the action helped them maximise their end goal.
For more information on machine learning, read this article:
Going back to the organising football match task; I want to know how many of my friends will attend the football match. I don’t have that information handy. Therefore, I want to cluster my friends into two clusters: Interested and Not Interested. That’s an unsupervised machine learning problem. So far so good!
4. Wait, What Is Clustering?
Clustering is used to group data into segments. Similar data are clustered together using a distance calculation algorithm such as Euclidean, Manhattan distance, Cosine similarity, Pearson correlation, etc. We have to use an unsupervised clustering algorithm as our data is not labeled.

5. What Are The Two Main Types Of Clustering?
There are mainly two types of clustering algorithms:
- Centroid-based clustering: When you know the number of clusters upfront. A number of clusters are known beforehand and then data is clustered into groups. These groups are known as centroids. Data is grouped into centroids based on how close they are to the center of the centroids. Algorithms include K-Means.
- Hierarchical clustering: When you want the machine to find the right number of clusters. Each data item is considered as a cluster and then data items are grouped together based on their distance recursively until optimum clusters of data are calculated. Algorithms include Agglomerative clustering.
There are also other clustering algorithm types such as distribution-based clustering which uses underlying probability distribution of the data to group data into clusters.

6. What Are The Most Common Unsupervised Clustering Algorithms?
Now that we have narrowed down the search, let’s find the handful of algorithms and choose one.
There are many unsupervised machine learning algorithms including:
K-Means, GMM, PCA and LDA.
Detailed comparison of algorithms is outlined here: Machine Learning Algorithms Comparison
I decided to choose K-Means because, one, it is popular. Scond, it will give us a sense of what we can achieve and lastly, it is pretty much transparent! We can always optimise the data set and choose a different algorithm. K-Means is my baseline algorithm.
7. Explaining the K-Means Algorithm
K-Means is an unsupervised clustering algorithm that is used to group data into k-clusters. The algorithm is simple:
Repeat the two steps below until clusters and their mean is stable:
- For each data item, assign it to the nearest cluster center. The nearest distance can be calculated based on distance algorithms. Initially, the first item becomes the cluster.
- Calculate the mean of the cluster with all data items and update if required.
Once clusters and their mean is stable, all data items are then known to be grouped into their relevant clusters.
There are however limitations of K-Means algorithm:
- K-Means algorithm does not work well with missing data.
- It uses a random seed to generate clusters which makes the results un-deterministic and random. We can, however, supply our own random seed number if we want to.
- It can get slower with larger data items. I only have a few data items.
- It does not work well with categorical (textual) data. All of my data is numerical now.

8. Use Python K-Means Algorithm To Cluster Data
I used Python SciKit Learn’s KMeans algorithm to cluster data into groups:
#KMeans Model
kmeans = KMeans(n_clusters=3)
kmeans.fit(X)
for i in range(0, X.shape[0]):
if (kmeans.labels_[i] == 1):
c1 = pl.scatter(X[i,0],X[i,1],c='g',marker='p')
elif (kmeans.labels_[i] ==0):
c2 = pl.scatter(X[i,0],X[i,1],c='r',marker='*')
pl.legend([c1, c2], ['Interested', 'Not Interested'])
pl.title('K-Means Of Interested Vs Not Interested Friends')
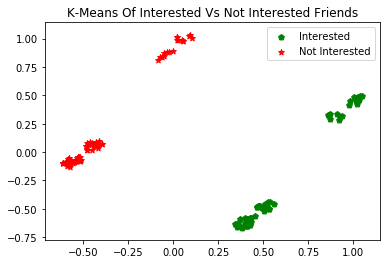
pl.show()As a result, the data items (friends) were clustered into two groups: Interested and Not Interested. This can be seen in the scatter plot below:
All of the green dots are the friends who are interested.
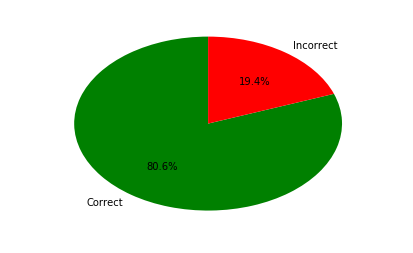
9. Testing
I went ahead and organised the football match. I then tested how many of my friends actually attended the football match. The algorithm showed pretty good accuracy; 80%+.
There must be other factors that I did not take into account which can potentially further improve the results.
Full Code
#import libraries
import pandas as pd
from sklearn.preprocessing import LabelEncoder
from sklearn.cluster import KMeans
import numpy as np
import matplotlib.pyplot as pl
#Read File
train = pd.read_csv(r"TrainFootballEvent.csv")#Encoding Categorical To Numerical Values
labelEncoder = LabelEncoder()
labelEncoder.fit(train['Area'])
train['Area'] = labelEncoder.transform(train['Area'])#Fill Missing Data
train.fillna("0", inplace=True)#lower age, more likely they will be interested to play
train['Age'] = train["Age"].apply(lambda x: (1/x))#drop Name column from the data
X = train.drop(['Name'], 1).astype(float).values#KMeans Model
kmeans = KMeans(n_clusters=3)
kmeans.fit(X)
for i in range(0, X.shape[0]):
if (kmeans.labels_[i] == 1):
c1 = pl.scatter(X[i,0],X[i,1],c='g',marker='p')
elif (kmeans.labels_[i] ==0):
c2 = pl.scatter(X[i,0],X[i,1],c='r',marker='*')
pl.legend([c1, c2], ['Interested', 'Not Interested'])
pl.title('K-Means Of Interested Vs Not Interested Friends')
pl.show()10. Improvements
We can further improve the accuracy by:
- Applying different clustering algorithms to increase accuracy
- Gather better data to ensure we capture all factors that can influence the results
- Tweek weights to get better results
- Introduction of more clusters along with Yes and No, such as MayBeYes and MayBeNo
11. Summary
Planning, managing and organising events is a big part of our life. Some businesses are based on events management. Most of our social events require us to better understand who might not attend and whether our target audience is right.
You can use a machine-learning algorithm to forecast and plan your events better. This example demonstrated how clustering works. Unsupervised clustering algorithms can help us identify groups within our data.
Additionally, clustering can be used in a number of fields to group large sets of data. These groups can then help us plan our events better and we can make calculated decisions. K-Means is a simple yet powerful algorithm. It has huge potential in finding anomalies and outliers in our data.
Please let me know if you have any feedback.