
How I Used ChatGPT to Analyze My Medium Stories
How to run and implement the Medium analyzer using Python
Not a member yet? Read for free here!
After a failed attempt to use ChatGPT to analyze Medium statistics, I took it upon myself to create a solution.
This guide will show you:
- What the analyzer is capable of
- How to use my tool for your Medium analytics
- How the analyzer is implemented
Capabilities of the Analyzer
The analyzer serves as a tool for optimizing your publishing strategy on Medium by offering insights into:
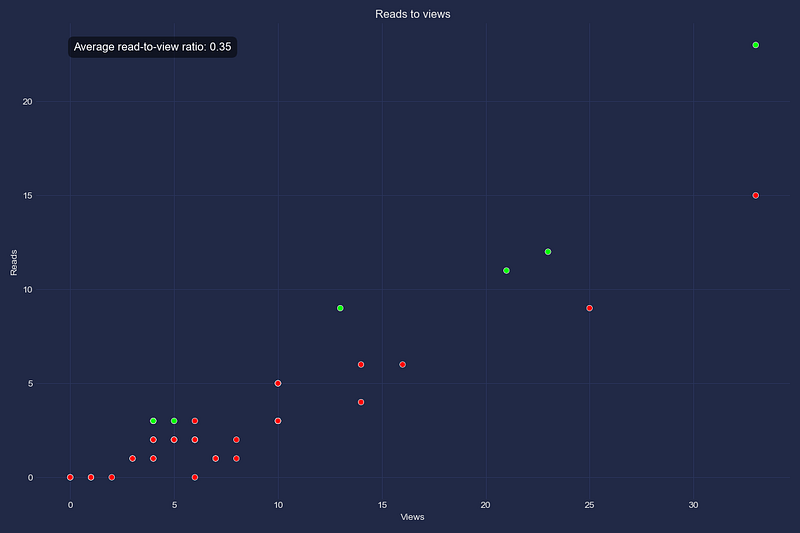
- Read-to-View Ratio: This feature allows you to assess the read-to-view ratio for each story.
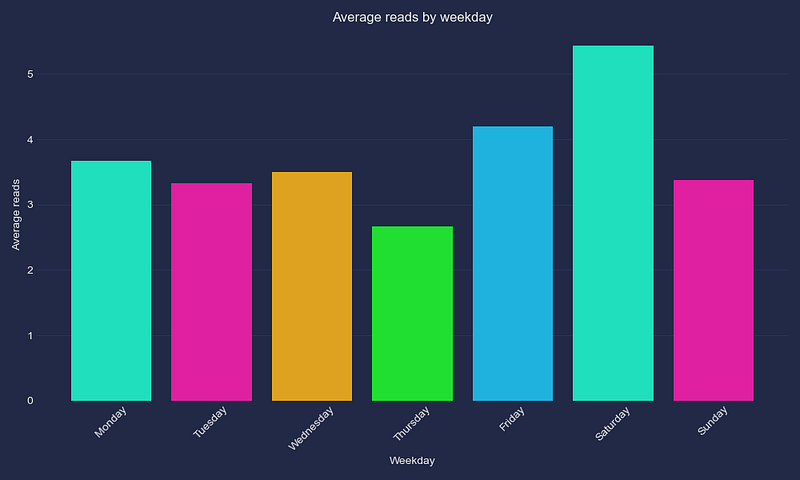
- Average Reads by Publishing Day: Understand which publishing day gives the highest engagement, allowing you to time your publications for maximum readership.
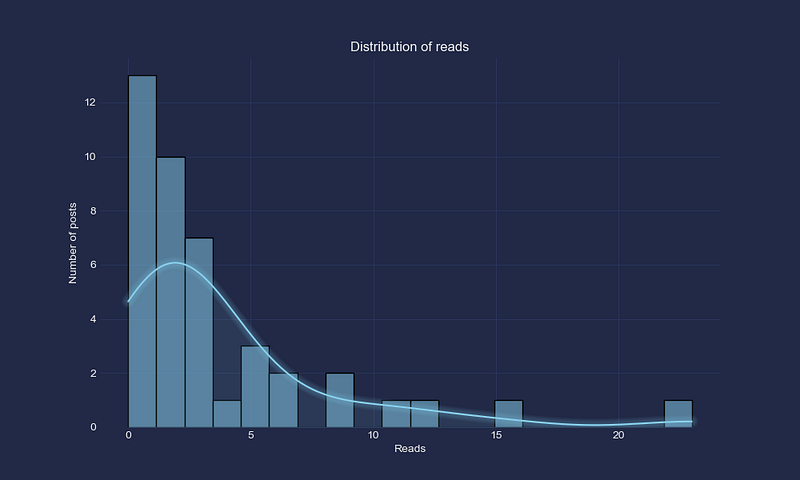
- Statistics Distribution: This functionality visualizes the distribution of reads and views across your Medium stories, helping you identify overall performance trends.
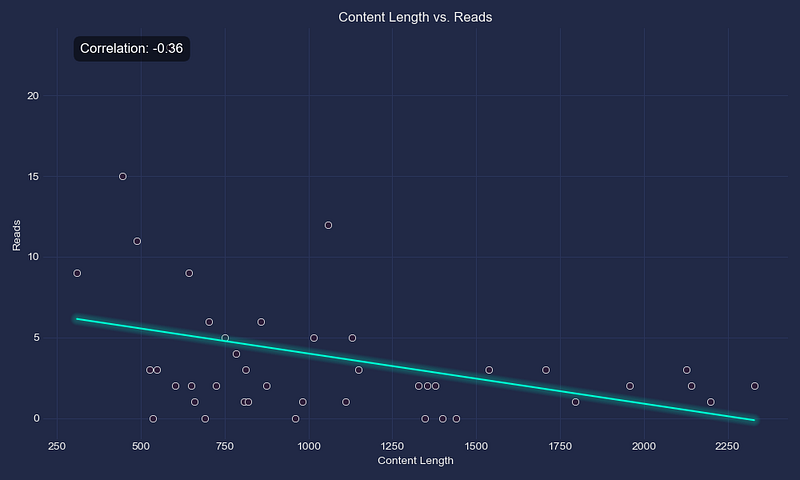
- Correlation Analysis: See the relationships between metrics such as content length, readability, sentiment, title length, and the number of reads.
How to Use the Analyzer
Excited to see what your Medium stories are really doing?
Here’s a simple guide to get you started!
Getting Started
First, make sure Python is installed (the tool is tested with Python 3.11)
Then, install the following necessary packages:
pip install nltk
pip install pandas
pip install textstat
pip install beautifulsoup4
pip install matplotlib
pip install mplcursors
pip install mplcyberpunk
pip install numpy
pip install seaborn
Export Medium Data
Follow these steps to export your Medium data:
- On your homepage, click on your profile picture and click Settings.
- Click the Security and apps tab.
- Click Download your information.
- Confirm by clicking Export.
- A link to download your archive will be sent to you by email when it is finished.
Setting Up the Tool
Clone the repository with the analysis tool:
$ git clone https://github.com/OliLov/python-projects.gitCreate CSV
We’ll need a CSV file. The CSV should have the following structure, [File name, Views, Reads]:
File,Views,Reads
2024-02-09_Drawing-with-AI---Your-Webcam-408de73fd1e1.html,0,0
2024-02-08_How-Do-We-Determine-If-a-Machine-Learning-Model-is-Good--462cb590db05.html,0,0
...
You can create this file yourself or use a script that comes with the tool:
$ python data_extraction/large_files_to_csv.py medium-export/Posts/Note: You’ll have to update the reads and views in the CSV manually, as I’ve not found a good way to extract this yet.
If you have a good way to extract the reads and views, please let me know!
Run the Program
Now, for the exciting part!
Let’s run it:
$ python medium/medium_post_analysis.py medium-export/Posts path/to/your/CSVThis will output individual story statistics:
'content_length': 1399,
'date': datetime.datetime(2024, 2, 9, 0, 0),
'readability_score': 43.59,
'reads': 0,
'sentiment_score': 0.998,
'title': 'Drawing with AI  Your Webcam 408de73fd1e1',
'title_length': 6,
'views': 0
And it will open one graph at a time. Just close the graph window to see the next plot!
Code Walkthrough
Let’s walkthrough the code together!
Create CSV
This part was already covered above, but we should have a CSV prepared:
File,Views,Reads
2024-02-09_Drawing-with-AI---Your-Webcam-408de73fd1e1.html,0,0
2024-02-08_How-Do-We-Determine-If-a-Machine-Learning-Model-is-Good--462cb590db05.html,0,0
...
Medium Statistics Plots
To make sense of our Medium stats, we’ll plot them. Let’s set up the imports:
from itertools import cycle
from typing import Any

import matplotlib.pyplot as plt
import mplcursors
import mplcyberpunk
import numpy as np
import pandas as pd
import seaborn as sns
Next, we’ll create a class MediumStatisticsPlotter. This is our class for plotting the graphs:
# Define a color palette
color_cycle = cycle(["#00ffd0", "#ff00ab", "#ffae00", "#00ff15", "#00c3ff"])

class MediumStatisticsPlotter:
    """Medium statistics plotter."""

    def __init__(self, analyses):
        """Initalize the Medium statistics plotter."""
        # Use Pandas DataFrame for easier access
        self.data = pd.DataFrame(
            {
                "Content Length": [a["content_length"] for a in analyses],
                "Readability Score": [
                    a["readability_score"] for a in analyses
                ],
                "Sentiment Score": [a["sentiment_score"] for a in analyses],
                "Title Length": [a["title_length"] for a in analyses],
                "Reads": [a["reads"] for a in analyses],
                "Views": [a["views"] for a in analyses],
                "Read-to-View Ratio": [
                    a["reads"] / a["views"] if a["views"] else 0
                    for a in analyses
                ],
                "Weekday": [a["date"].weekday() for a in analyses],
                "Titles": [a["title"] for a in analyses],
            }
        )

        # Customize seaborn theme.
        plt.style.use("cyberpunk")
        sns.set_palette("mako")
To make distribution plots, we have the helper function:
def __plot_distributions(self, column, title, xlabel):
    """Plots the distribution of a specified metric."""
    plt.figure(figsize=(10, 6))
    sns.histplot(self.data[column], bins=20, color="skyblue", kde=True)
    plt.title(title)
    plt.xlabel(xlabel)
    plt.ylabel("Number of posts")

    mplcyberpunk.add_glow_effects()
    plt.show()
Now, we can implement the distribution functions:
def plot_reads_distribution(self):
    """Plots the distribution of reads across Medium posts."""
    self.__plot_distributions("Reads", "Distribution of reads", "Reads")

def plot_views_distribution(self):
    """Plots the distribution of views across Medium posts."""
    self.__plot_distributions("Views", "Distribution of views", "Views")
Then, we have the helper function for the correlation plots:
def __plot_correlation(self, x_name, y_name, xlabel, ylabel, title):
    """Plots and annotates the correlation between two variables."""
    plt.figure(figsize=(10, 6))
    sns.scatterplot(x=x_name, y=y_name, data=self.data)

    corr = np.corrcoef(self.data[x_name], self.data[y_name])[0, 1]
    slope, intercept = np.polyfit(self.data[x_name], self.data[y_name], 1)

    line_x = np.linspace(
        self.data[x_name].min(), self.data[x_name].max(), 100
    )
    line_y = slope * line_x + intercept

    plt.plot(line_x, line_y, color=next(color_cycle))
    plt.title(title)
    plt.xlabel(xlabel)
    plt.ylabel(ylabel)

    plt.annotate(
        f"Correlation: {corr:.2f}",
        xy=(0.05, 0.95),
        xycoords="axes fraction",
        ha="left",
        va="center",
        fontsize=12,
        color="white",
        bbox={
            "boxstyle": "round,pad=0.5",
            "fc": "black",
            "ec": "none",
            "alpha": 0.5,
        },
    )

    mplcyberpunk.make_lines_glow()
    cursor = mplcursors.cursor(hover=True)
    cursor.connect(
        "add",
        lambda sel: sel.annotation.set_text(
            self.data.iloc[sel.index]["Titles"]
        ),
    )
    cursor.connect(
        "add",
        lambda sel: sel.annotation.get_bbox_patch().set(
            fc="black", alpha=0.7
        ),
    )

    plt.tight_layout()
    plt.show()
Let’s implement the correlation function:
def plot_correlation_between(self, attribute1, attribute2):
    """Plots the correlation between two specified attributes."""
    self.__plot_correlation(
        attribute1,
        attribute2,
        xlabel=attribute1,
        ylabel=attribute2,
        title=f"{attribute1} vs. {attribute2}",
    )
Let’s implement the function for plotting average reads by publishing day:
def plot_weekday_reads_correlation(self):
    """Average reads and the weekday of publishing correlation."""
    plt.figure(figsize=(10, 6))

    day_names = [
        "Monday",
        "Tuesday",
        "Wednesday",
        "Thursday",
        "Friday",
        "Saturday",
        "Sunday",
    ]
    self.data["Weekday Name"] = self.data["Weekday"].apply(
       lambda x: day_names[x]
    )

    weekday_reads_avg = (
        self.data.groupby("Weekday Name")["Reads"]
        .mean()
        .reindex(day_names)
    )

    sns.barplot(
        x=weekday_reads_avg.index,
        y=weekday_reads_avg.values,
        palette=color_cycle
    )

    plt.title("Average reads by weekday")
    plt.xlabel("Weekday")
    plt.ylabel("Average reads")
    plt.xticks(rotation=45)

    mplcyberpunk.add_glow_effects()

    plt.tight_layout()
    plt.show()
Now, we implement the function for plotting the read-to-view ratio:
def plot_reads_to_views(self) -> None:
    """Plots the reads to views ratio"""
    plt.figure(figsize=(12, 8))

    read_view_ratio = self.data["Read-to-View Ratio"]
    self.data["Color"] = read_view_ratio.apply(
       lambda x: "lime" if x > 0.5 else "red"
    )

    sns.scatterplot(
        x="Views",
        y="Reads",
        hue="Color",
        data=self.data,
        palette=["red", "lime"],
        legend=False,
    )

    plt.title("Reads to views")
    plt.xlabel("Views")
    plt.ylabel("Reads")

    average_ratio = read_view_ratio.mean()
    plt.annotate(
        f"Average read-to-view ratio: {average_ratio:.2f}",
        xy=(0.05, 0.95),
        xycoords="axes fraction",
        ha="left",
        va="center",
        fontsize=12,
        color="white",
        bbox={
            "boxstyle": "round,pad=0.5",
            "fc": "black",
            "ec": "none",
            "alpha": 0.5,
        },
    )

    mplcursors.cursor(hover=True).connect(
        "add",
        lambda sel: sel.annotation.set_text(
            self.data.iloc[sel.index]["Titles"]
        ),
    )

    plt.tight_layout()
    plt.show()
And there we have it! Let’s create the entry point for the script.
Medium Post Analysis
This will be the entry point for our script. Let’s begin with the imports:
import argparse
from datetime import datetime
from pathlib import Path
from pprint import pprint
from typing import Any

import nltk
import pandas as pd
import textstat
from bs4 import BeautifulSoup
from medium_statistics_plots import MediumStatisticsPlotter
from nltk.sentiment import SentimentIntensityAnalyzer
Now for the main function:
def main(posts_directory, csv_path):
    """Main function to execute the Medium post analysis."""
    analyses = analyze_posts(posts_directory, csv_path)

    pprint(analyses)
    medium_stats = MediumStatisticsPlotter(analyses)

    medium_stats.plot_reads_distribution()
    medium_stats.plot_views_distribution()
    medium_stats.plot_reads_to_views()
    medium_stats.plot_correlation_between("Content Length", "Reads")
    medium_stats.plot_correlation_between("Readability Score", "Reads")
    medium_stats.plot_correlation_between("Sentiment Score", "Reads")
    medium_stats.plot_correlation_between("Title Length", "Reads")
    medium_stats.plot_weekday_reads_correlation()

if __name__ == "__main__":
    parser = argparse.ArgumentParser(
        description="Analyze Medium posts from a directory and CSV"
    )
    parser.add_argument(
        "posts_directory", type=str, help="Directory path to the posts"
    )
    parser.add_argument(
        "csv_path", type=str, help="Path to the CSV file with post statistics"
    )

    args = parser.parse_args()

    main(Path(args.posts_directory), Path(args.csv_path))
Now we see that we are missing the analyze_posts function:
def analyze_posts(posts_directory, csv_path):
    """Analyze posts."""
    medium_stats = pd.read_csv(csv_path)
    analyses = []
    stats_dict = {
        row["File"]: {"views": row["Views"], "reads": row["Reads"]}
        for _, row in medium_stats.iterrows()
    }
    sia = SentimentIntensityAnalyzer()

    for file_path in posts_directory.iterdir():
        file_name = file_path.name
        if file_name in stats_dict.keys():
            with open(file_path, "r", encoding="utf-8") as current_file:
                content = current_file.read()
                soup = BeautifulSoup(content, "html.parser")

                text = soup.get_text(separator=" ", strip=True)

                content_length = len(nltk.word_tokenize(text))
                sentiment_score = sia.polarity_scores(text)["compound"]
                title = soup.title.string if soup.title else ""
                title_length = len(nltk.word_tokenize(title))
                readability_score = textstat.flesch_reading_ease(text)

                views = stats_dict[file_name]["views"]
                reads = stats_dict[file_name]["reads"]

                title, date = extract_title_and_date(file_name)
                analyses.append(
                    {
                        "title": title,
                        "date": date,
                        "content_length": content_length,
                        "sentiment_score": sentiment_score,
                        "title_length": title_length,
                        "readability_score": readability_score,
                        "views": views,
                        "reads": reads,
                    }
                )
        else:
            print(f"File not found in CSV: {file_name}")

    return analyses
Let’s implement the function for extracting title and date from a file name:
def extract_title_and_date(file_name):
    """Extracts the title and date from a file name."""
    parts = file_name.split("_")

    date_str = parts[0] if len(parts) > 0 else None
    date = datetime.strptime(date_str, "%Y-%m-%d") if date_str else None

    title_part = "_".join(parts[1:])
    title = title_part.replace("--", " ").replace("-", " ") if len(parts) > 1 else None

    if title:
        title_parts = title.rsplit(" ", 1)
        if len(title_parts) > 1:
            title = title_parts[0]
        else:
            title_parts = title.rsplit(".", 1)
            if len(title_parts) > 1:
                title = title_parts[0]

    return title, date
Now everything has been implemented, and you should be able to run the program!
Final Words
And there you have it!
Let me know if you would like me to extend this project further with more stats and a user-friendly interface so that it’s accessible to everyone on Medium.
Did you like this story?
- 💬 Share your thoughts and what you have learned from your own Medium analysis!
- ✅ Follow Oliver Lövström
- 👏 Give this story 50 claps!
- ☕ Support me by buying me a coffee
That wraps up Day 21 of Our 30-Day Coding Series: Are you interested in Python, machine learning, and health? Find more details right here!
Yesterdays project:
Links
- Exporting Your Medium Account Data: For a step-by-step guide on how to download all your Medium information, check out Medium’s official help guide.
- Project Repository on GitHub: Access all the code from the 30-day challenge at Python Projects repository.
- Script for Post Analysis: View the Post analysis script on GitHub.
- Listing Large Files in a Directory: See how we created the CSV in this Medium article.
Original story:
All the best wishes!

P.S. Check out my toolbox to keep code clean and maintainable!


