
How I Use PandasAI to Complete 10 Most Frequent Tasks in Data Science
A Quick Introduction and Development Guide For Pandas AI

Overall
Pandas is a powerful open-source library that has long been the best choice for data scientists and analysts, offering convenient data manipulation and analysis capabilities. Pandas AI is a brand-new Python library that integrates generative artificial intelligence capabilities into Pandas, transforming dataframes operations into conversations.
By enabling interactive communication with datasets powered by large language models like ChatGPT, Pandas AI allows you to speak directly to your data, receiving structured responses. Data scientists and analysts can almost have zero programming knowledge when handling data analysis works. As the author of Pandas AI said, Pandas AI is not here to replace Pandas but to enhance it significantly. With Pandas AI, they can explore novel methods and processes to streamline their data preparation efforts, effectively saving time and energy.
In this article, we will explore 10 typical data processing tasks that Pandas can accomplish normally, converting the way from coding to chatting by Pandas AI to see whether the data science work can be simplified by AI language models and prompt engineering.
Preparation
Before we explore Pandas tasks, let’s create the necessary code to enable the entire Python program. Please note that the source code for all the following demonstrations is shared in my Colab notebooks. Please feel free to copy, run and change them for further tests. https://colab.research.google.com/drive/18AmQAYhICrWQrnfdOlMdFAfwBfuqbQEt?usp=sharing
a) Install the packages
!pip install pandas pandasaib) Import the modules
As PandasAI calls Pandas for data processing and OpenAI for AI generation internally, so we must import both pandas and pandasai.llm.openai.
import pandas as pd
from pandasai import PandasAI
from pandasai.llm.openai import OpenAI
c) Load the OpenAI LLM
OPENAI_API_KEY = "{Your_API_Key}"
llm = OpenAI(api_token=OPENAI_API_KEY)
d) Create the dataframe
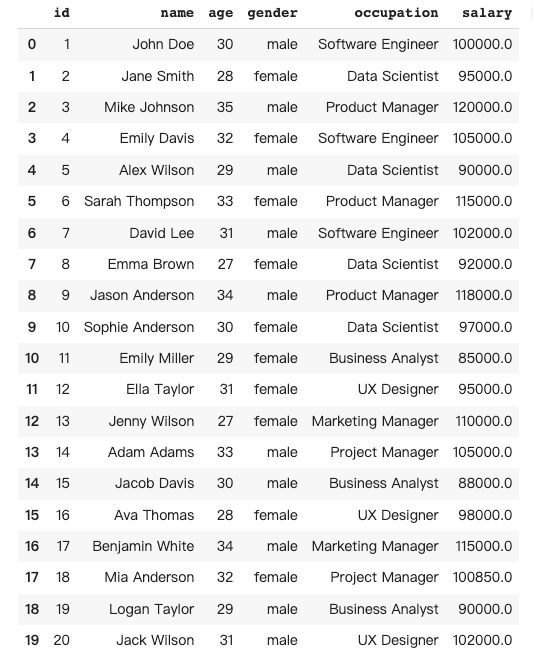
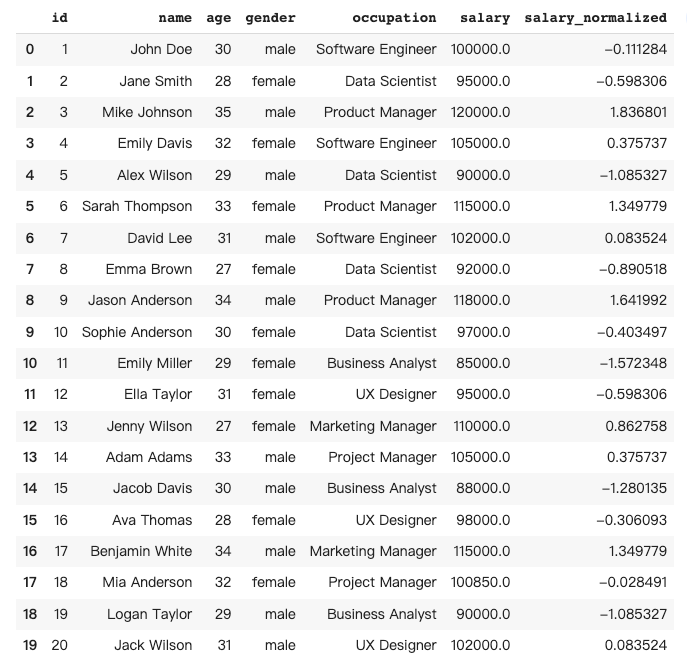
For the following demonstrations, a dataframe df of fake employees' information including name, age, gender, occupation, and the salary was created.
data = [
    [1, "John Doe", 30, "male", "Software Engineer", 100000],
    [2, "Jane Smith", 28, "female", "Data Scientist", 95000],
    [3, "Mike Johnson", 35, "male", "Product Manager", 120000],
    [4, "Emily Davis", 32, "female","Software Engineer", 105000],
    [5, "Alex Wilson", 29, "male", "Data Scientist", 90000],
    [6, "Sarah Thompson", 33, "female","Product Manager", 115000],
    [7, "David Lee", 31, "male", "Software Engineer", 102000],
    [8, "Emma Brown", 27, "female","Data Scientist", 92000],
    [9, "Jason Anderson", 34, "male", "Product Manager", 118000],
    [10, "Sophie Anderson", 30, "female","Data Scientist", 97000],
    [11, "Emily Miller", 29, "female", "Business Analyst", 85000],
    [12, "Ella Taylor", 31, "female","UX Designer", 95000],
    [13, "Jenny Wilson", 27, "female", "Marketing Manager", 110000],
    [14, "Adam Adams", 33, "male","Project Manager", 105000],
    [15, "Jacob Davis", 30, "male", "Business Analyst", 88000],
    [16, "Ava Thomas", 28, "female","UX Designer", 98000],
    [17, "Benjamin White", 34, "male", "Marketing Manager", 115000],
    [18, "Mia Anderson", 32, "female","Project Manager", ],
    [19, "Logan Taylor", 29, "male", "Business Analyst", 90000],
    [20, "Jack Wilson", 31, "male","UX Designer", 102000],
    [12, "Ella Taylor", 31, "female","UX Designer", 95000],
]


# Create a DataFrame from the data
df = pd.DataFrame(data, columns=["id", "name", "age", "gender", "occupation", "salary"])
e) Create PandasAI object
pandas_ai = PandasAI(llm)
Without any further ado, let’s code with PandasAI.
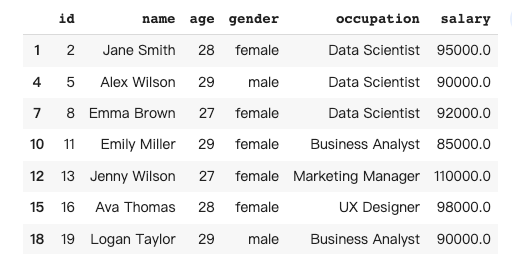
1. Data selection
Data selection in pandas involves selecting specific rows and columns from a dataframe based on certain conditions or criteria.
In this case, I would like to have a dataframe that only contains people under 30.
The prompt:
df1 = pandas_ai.run(df, prompt='''
give me a dataframe that contains the people under age 30
''', is_conversational_answer=False)
The response of Pandas AI:
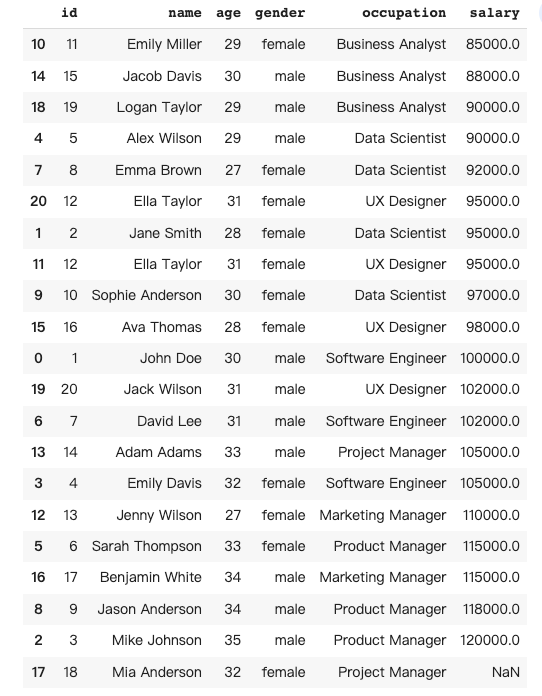
2. Data sorting
Data sorting in pandas involves arranging data in a dataframe based on the values in one or more columns in either ascending or descending order.
In this case, I would like to have a dataframe with ascending order of salary.
The prompt:
df2 = pandas_ai.run(df, prompt='''
give me a dataframe that sort the salary in ascending order
''', is_conversational_answer=False)
The response of Pandas AI:
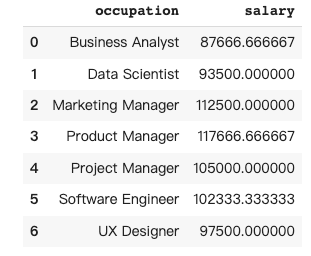
3. Data aggregation
Data aggregation in Pandas involves the process of grouping and summarizing data from a dataframe to gain insights and derive meaningful conclusions.
In this case, I would like a dataframe that provides the average salary for each occupation.
The prompt:
df3 = pandas_ai.run(df, prompt='''
give me a dataframe that group the occupation and provide average salary
''', is_conversational_answer=False)
The response from Pandas AI:
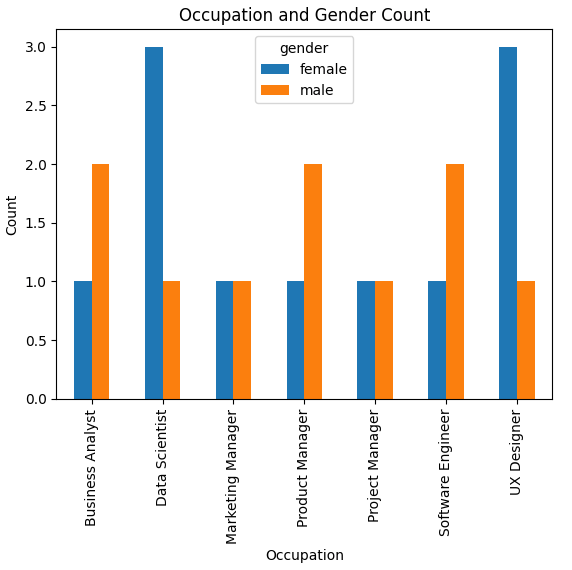
4. Data reshaping
Data reshaping in pandas involves changing the layout of a dataframe to better suit the needs of the analysis, for example, by pivoting, stacking, or melting data to create a new structure.
In this case, I would like to have a bar chart that reflects a pivot table to see the gender difference in each occupation.
The prompt:
df4 = pandas_ai.run(df, prompt='''
bar chart a pivot table that show the people count under occupation and gender
''', is_conversational_answer=False)
The response from Pandas AI:
5. Data cleaning
Data cleaning in pandas involves preparing a dataframe by detecting and handling missing, duplicate, or incorrect data to make it suitable for analysis.
In this case, I would like to ask Pandas AI to autofill the missing salary number for “Mia Anderson”, and remove the duplicated rows of “Ella Taylor”.
The prompt:
df5 = pandas_ai.run(df, prompt='''give me a dataframe that
1) fill in the missing data
2) delete the duplicated rows
''', is_conversational_answer=False)
The response from Pandas AI:
6. Data merging
Data merging in pandas involves combining two or more dataframe into a single dataframe based on one or more common columns.
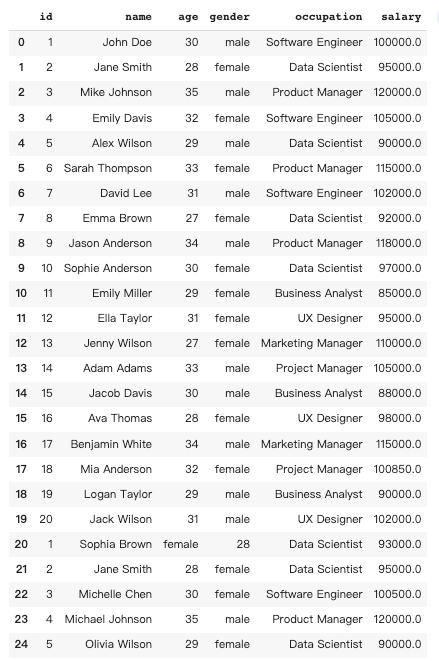
In this case, I would like to add information about another 5 people to the original dataframe.
Another dataset:
data2 = [
    [1, "Sophia Brown", "female",  28, "Data Scientist", 93000],
    [2, "Jane Smith", 28, "female","Data Scientist", 95000],
    [3, "Michelle Chen", 30, "female","Software Engineer", 100500],
    [4, "Michael Johnson", 35, "male","Product Manager", 120000],
    [5, "Olivia Wilson", 29, "female","Data Scientist", 90000],
]

df2 = pd.DataFrame(data2, columns=["id", "name", "age", "gender", "occupation", "salary"])
The prompt:
pandas_ai.run([df,df2], prompt='''
give me a dataframe that combine all the rows
''', is_conversational_answer=False)
The response of Pandas AI:
7. Data transformation
Data transformation in Pandas involves manipulating and changing the structure or content of a dataframe to make it more suitable for analysis or to gain insights from the data.
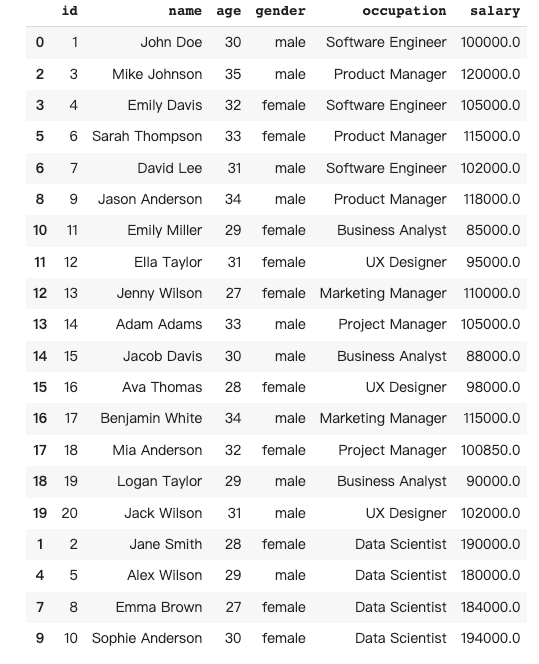
In this case, I would like to double the salary for all data scientists.
The prompt:
df7 = pandas_ai.run(df, prompt='''
give me a dataframe that double the salary to all the data scientists
''', is_conversational_answer=False)
The response from Pandas AI:
8. Describe
The describe() method in Pandas provides a summary of the central tendency, dispersion, and shape of a dataframe’s distribution, by computing various statistics such as count, mean, standard deviation, minimum, and maximum values.
The prompt:
df8 = pandas_ai.run(df, prompt='''
Pandas describe the dataframe
''', is_conversational_answer=False)
The response from Pandas AI:
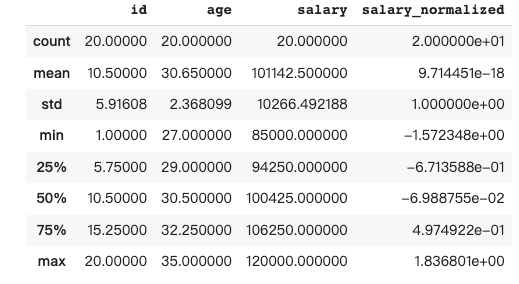
9. Data normalization
Data normalization in Pandas is the process of scaling numerical data to a common range, such as between 0 and 1, to remove bias and make the data more comparable and easier to analyze.
In this case, I would like to normalize the salary by subtracting the mean and dividing it by the standard deviation.
The prompt:
pandas_ai.run(df, prompt='''
give me a dataframe that normalizing every salary by subtracting mean
and dividing by standard deviation
''', is_conversational_answer=False)
The response from Pandas AI:
10. Time series analysis
Time series analysis in pandas involves analyzing data that is indexed by time, such as daily stock prices or hourly weather data, to identify patterns, and trends, and make forecasts or predictions based on historical data.
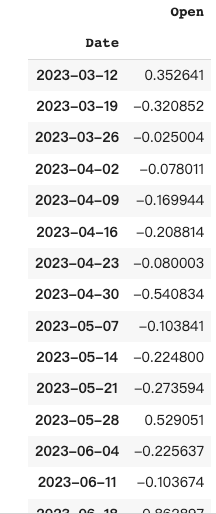
In this case, I create another fake dataset to list the random data for 100 days. The task for Pandas AI is to resample the data from a daily basis to a weekly basis with mean function.
The original dataset:
import numpy as np
df_t = pd.DataFrame({'Date': pd.date_range('2023-03-07', periods=100), 'Open': np.random.randn(100)})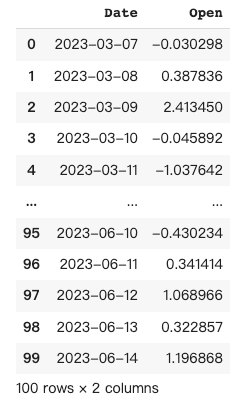
The prompt:
pandas_ai.run(df_t, prompt='''
Resample the DataFrame to a weekly frequency and take the mean
''', is_conversational_answer=False)
The response from Pandas AI:
Conclusion
Based on my personal experience with Pandas AI, the tool can be very helpful for users who may not be familiar with how to use pandas; however, it is important to exercise care in selecting the appropriate prompt to ensure accurate answers are generated. Ultimately, it is up to the user to make the best choice.
Thanks for reading. If you think it’s helpful, please Clap 👏 for this article. Your encouragement and comments mean a lot to me, mentally and financially. 🍔
Before you go:
🎥 If you prefer video tutorials, please subscribe to my YouTube channel where I started to convert most of my articles to visual demonstrations.
✍️ If you have any questions or requests, please leave me responses or find me on Twitter (Now X) and Discord where you can have my active support on development and deployment.
☕️ If you would like to have exclusive resources and technical services, joining the membership of my Ko-fi will be a good choice.