
Software Engineering
My Workflow To Profile Python Code Using VS Code

Introduction
This article describes how I use VS Code to profile Python code to identify CPU or memory problems.
To make things more concrete and practical, I will demonstrate how the workflow works by quickly finding the source of high CPU utilization in a real-world project: the RulePolicy class in the rasa open source project in release 2.8.22.
The code to reproduce the workflow described in this article is here.
Problem Statement
Imagine you received a bug report claiming that a chatbot built using rasa has unreasonably high CPU utilization and the report writer claims that it is the RulePolicy class that is causing it.
You attempt to reproduce the behavior using the information shared in the bug report and indeed, you too observe high CPU utilization.
The next step is to find out how this could happen. How do you go about doing this?
The easiest thing to do is to ask your senior colleagues for their thoughts. Unfortunately, the authors who wrote that class is no longer around and everyone else can just offer generic or vague ideas.
At this point, you are practically on your own. You have to figure out the source of the high CPU utilization yourself. How would you go about doing this?
You could start by reading the code…
Let’s see how far you can go with this approach.
The bug report mentions that the problem only occurs at inference time and you know that the predict_action_probabilities method is the main entry point at inference time. So, this looks like a good place to start reading.
This is what the method looks like:

Turns out the method is pretty straight forward: It just calls another method, _predict. Let’s see how this method works:

_predict has a very long implementation which has many branches and calls other functions too.
Even if you do decide to tough it out and trace the entire implementation line by line, there’s no guarantee you’ll actually understand what each line is doing or supposed to do, much less the actual lines that are causing the high CPU utilization.
This is where a profiler comes in handy to quickly zero in on the offending lines.
Solution
Overview
These are the main steps I follow to profile python code (or any language for that matter):
- Set up a containerized environment
- Write a minimal script that will call the function we want to profile
- Reproduce the problem
- Set up the debugging infrastructure
- Profile the script
- Visualize and analyse the results
- Experiment with various fixes [Optional]
Step 1: Set up a containerized environment
We should do our analysis in a containerized environment so that it is easy for us to share our results with colleagues.
This is easily accomplished with VS Code as it allows developers to seamlessly create a container, login to it, and code as if they are on their local machine. Refer to VS Code’s Developing inside a Container guide for details.
In this example, we will create a container based on the rasa/rasa:2.8.22-full image because that is the version where the high CPU utilization problem was reported.
Step 2: Write a minimal script that will call the function we want to profile
The word “minimal” is important. In other words, we want to call the function we think is problematic directly or as direct as possible.
Why?
Suppose you decide to reproduce this behavior by building an entire bot from scratch and testing the CPU load by talking to it. This will slow down your analysis later because every change you make will require booting up the bot and talking to it to assess the impact of your change. Furthermore, there are many moving parts in a bot so even if you witness high CPU load when talking to it, it is hard to be certain that it is happening somewhere inside the RulePolicy’s predict_action_probabilities method.
So, how do we figure out the quickest way to call the method?
A good place to start is to read the test cases for the RulePolicy class. Of course, this assumes you are working in a team that has been diligently following software engineering best practices. If that is not the case, then you have bigger problems to solve :)
Reading the test_potential_contradiction_resolved_by_conversation_start_when_slot_initial_value function, we learn that this is the most direct way to call the RulePolicy’s predict_action_probabilities method:

predict_action_probabilities methodNotice that we have encapsulated the call to the predict_action_probabilities the method in another function called problem_function . This looks redundant but is actually very important because we want to prevent other function calls e.g. DialogueStateTracker.from_events from influencing the timings of rule_policy.predict_action_probabilities later.
Also, since we are going to be running this script repeatedly, it helps to have a shortcut to quickly do it. We can use a makefile for this

Step 3: Reproduce the problem
Now we’re ready to test the bug reporter’s claim that the RulePolicy is the cause of high CPU load at runtime!
To do this, we can repeatedly call the script we wrote in the previous step and observe the CPU load while the script is running using a tool like htop :

In Figure 5, we call the minimal script 3 times and notice that there is always a spike in one of the CPU cores. But this could just be due to TensorFlow loading our model into memory.
To be sure that this is not the case, we can insert a call sleep to sleep for 5 seconds right before the problem_function and observe the CPU load after that interval. I will omit this step from this article for brevity.
Step 4: Set up the debugging infrastructure
Now that we’ve confirmed there’s something wrong or inefficient with the implementation of rule_policy.predict_action_probabilities , we should configure the script to run with a debugger attached to it so that we can examine the script’s state throughout its execution.
This step is very easy to set up VS Code since we’ve isolated the problem into a single python script. We just need to create a launch configuration that will debug a current file:

Notice that we’ve set justMyCode to false (line 13). If we had set this to true , then none of the breakpoints we insert in the rasa library will have any effect.
Step 5: Profile the script
We can use the cProfile module to time the function calls in main.py . It outputs a bunch of stats that can be cumbersome to read on the terminal, so we should have it to a file using the following command:

Step 6: Visualise and analyze the results
We can use the pstats module to manipulate the contents of the cprofile.stats we created in the preceding step.
However, it is easier to start the analysis by visualizing the results using the snakeviz module:

Figure 8 shows that snake via starts a web server on port 8080 inside the container. However, VS Code somehow detects this and will automatically forward that port so you should see this prompt:

Clicking the “Open in Browser” button and navigating to the function calls made from problem_function we see:

The predict_action_probabilities the function took 3.03 seconds to run. This function calls _predict which in turn calls find_action_from_rules which calls _get_possible_keys .
It seems that there’s an anonymous function inside the _get_possible_keys a function that takes up most of the execution time (2.97 seconds out of a total of 3.02 seconds). Conveniently, the chart in Figure 10 tells us that we can find this function in the rule_policy.py file at line 895. Let's see what this function does:

Is the anonymous function slow because possible_keys is really large or because the predicate function, self._is_rule_applicable is it a CPU-intensive function?
We can check for the former case by looking at how long it takes for python to loop through a set and do some simple operations. For example:

Figure 12 shows that making function calls over a set of 1 million elements takes less than 1 second. Doing the same over a set of 10 million elements takes almost 2 seconds.
How big is possible_keys ? This is easy to check using log points:


We see that the possible_keys the variable has only 4,082 elements and the states the variable has only 2 elements.
Therefore, we conclude that the main reason for the high CPU load has more to do with the implementation of self._is_rule_applicable than looping over the states and possible_keys data structure.
Mystery solved!
Step 7 Experiment with various fixes [Optional]
At this point, we could file a new bug report to let the developers know that they need to reconsider their implementation of self._is_rule_applicable or maybe even _get_possible_keys .
We could also poke around a bit more to see if we can come up with a quick fix ourselves.
Looking back at Figure 10, we see that _is_rule_applicable spends most of its time in the _rule_key_to_state function. This is what the function looks like:

_rule_key_to_state definitionThe purpose of this function is to convert a piece of text into a JSON object/python dictionary. The interesting part to note is that this function has a lru_cache decorator and is set to only cache 1,000 elements.
What would happen if we set maxsize to 5,000? Would this solve the high CPU utilization problem?
Before we do that, let’s return to snakeviz to see the stats of the json.loads function calls when maxsize=1000 :

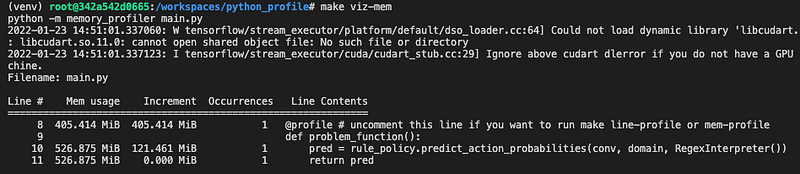
Let’s also monitor the memory usage using the memory_profiler module:

Figure 16 shows that the function consumes 27.312 MiB of memory when maxsize=1000 . Note that there is an open bug at the time of writing about how memory usage is reported when objects are destroyed. See this issue for details.
Here’s what happens when we set maxsize to 5,000:


The effects of increasing maxsize from 1,000 to 5,000 are:
- 50% reduction in the number of calls to
json.loads() - Almost 5x increase in memory usage
- 28% decrease in running time
The decrease in running time may not look significant but bear in mind that this is based on the profile of 1 call to problem_function() . Modifying main.py to call problem_function()many times will show even bigger time savings.
More importantly, the high CPU load is less pronounced now (results omitted from this article).
So, the setting maxisze=5000 could be an acceptable temporary quick fix.
Conclusion
This article has explained the workflow I use to profile python code using VS Code. We’ve learned how tools like docker, make, cprofile, snakeviz, etc can be used to quickly identify performance bottlenecks in code and evaluate the impact of fixes.
I hope you have found this useful.
For more tips and tricks on profiling python code, I highly recommend [1].
Reference
[1] High Performance Python, 2nd Edition. Micha Gorelick and Ian Ozsvald. 2020.


