How I Analyzed Medium’s Popular Page With Python (Part 1)
Data collection and pre-processing: parsing HTML with XPath, processing data, and creating a pandas DataFrame

Discussion about COVID-19 spread as fast as the virus itself. It’s become the most mentioned pandemic in history.
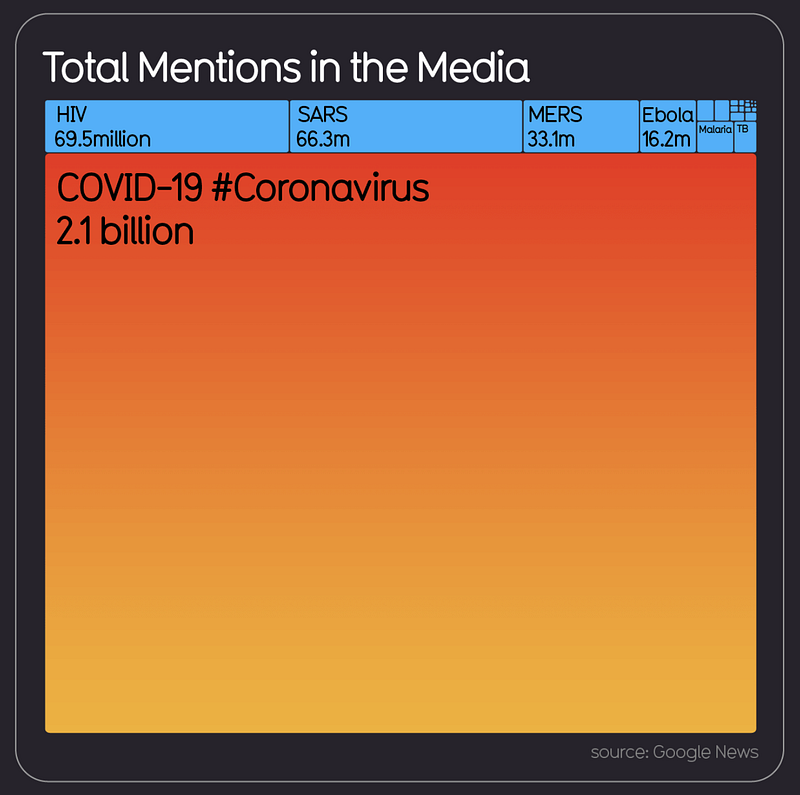
After I saw that image, I had a question: How popular is COVID-19 on Medium?
I had seen a lot of articles about this on my personal recommendations and the publications I follow. However, I wasn’t sure if I was sitting in an echo chamber or if the entirety of Medium really was talking about the virus.
I published my findings on Medium a couple of days ago. Now, I’m going to present my findings again — only this time, I will also show every step of the process I took to answer my main question. This piece is part one of that process, namely data collection and pre-processing. Part two will focus on the analysis. The full code this article walks through is at the very bottom.
Getting the Data Ready
Where should I get the data?
Step one was to figure out how to best track popular articles on Medium. Scraping every single article was out of the question. I Googled “popular articles on Medium” and was greeted with this:
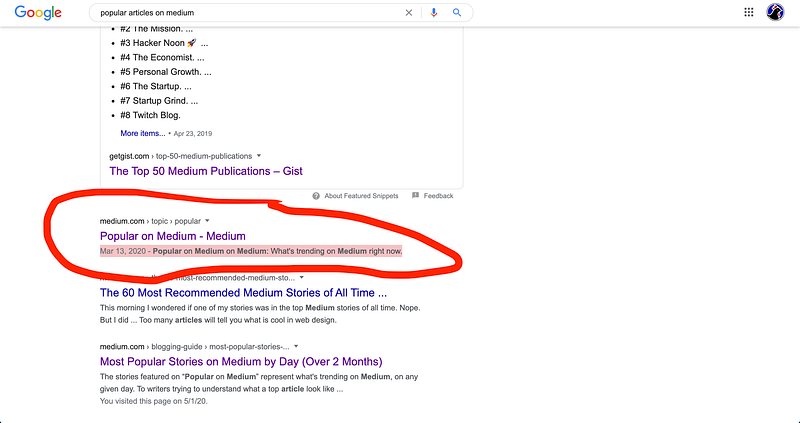
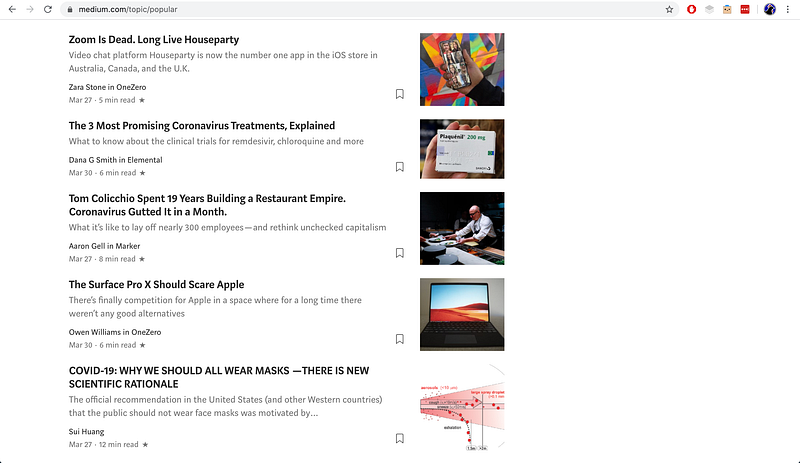
I only started using Medium recently, so I wasn’t aware that there was a whole page dedicated to “What’s trending on Medium right now.” And yes, I know it’s on the bar at the top of the Medium page, but I’d never clicked on it before. When I saw the page, it was exactly what I needed: a list of articles trending on Medium.
I also noticed that the page wasn’t static. The top of the page featured articles published most recently and scrolling down led to articles published earlier.
How should I get the data?
I wanted to collect data from as early as November 2019, before COVID-19 really blew up on social media. Now, I’ve used Python’s Scrapy library in the past for a simple project, so that’s what I thought of using to grab Medium article data.
However, my knowledge of web-scraping is still pretty limited. I know that there are a couple of different ways to scroll on a web page so you can scrape data below (e.g. Splash and Selenium). In the past, I hadn’t done this before, as my projects only required a simple crawler to scrape static sites.
I didn’t want to spend too much time figuring out how to do this, as I mainly wanted to focus on the analysis of the data. I decided to take a shortcut of sorts by scrolling all the way down the Popular page until I got to November 2019. Then I saved a copy of the page to my desktop.
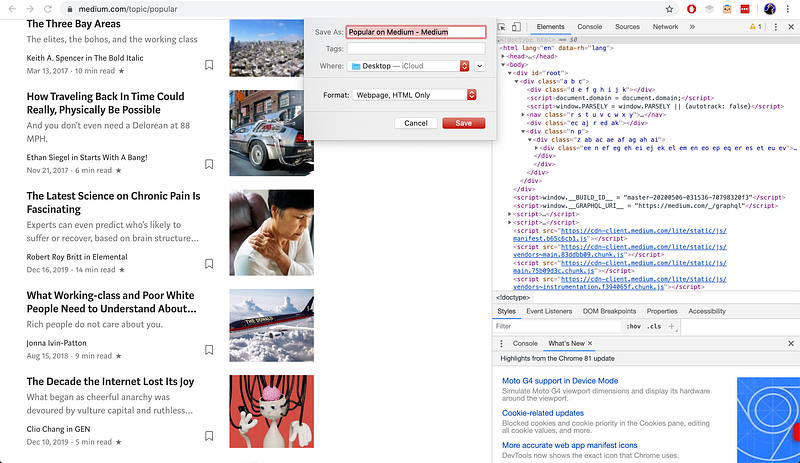
Now, I could use Python to scrape the local HTML file I had saved.
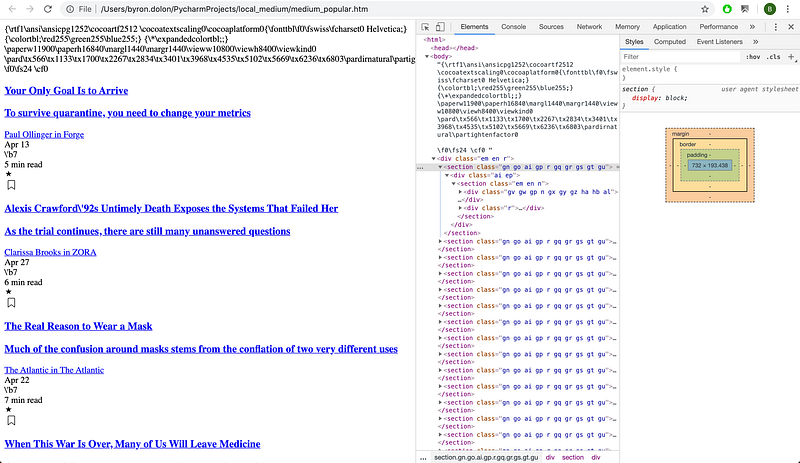
To select the Title, Subtitle, Date Published, Author, and Read Time, I needed to write the relevant XPath selectors. The first answer to this Stack Overflow question gave me some initial code that would let me parse the HTML with XPath:
The HTML classes had spaces, so I had to use contains in the XPath selector to get the classes. To get all of them, I just moused over each element I needed on the web page and the Chrome inspector highlighted it for me. That allowed me to write every XPath selector I needed. The output for the Title was a list that looked like this:
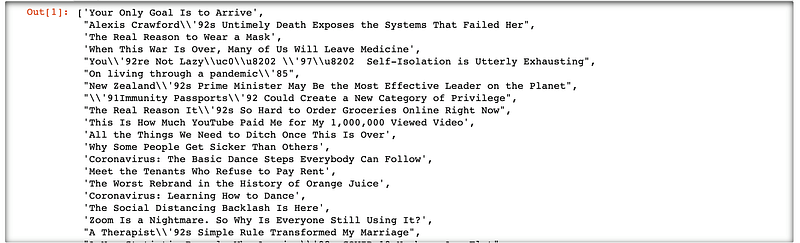
The subtitles looked similar to this, so I got all the raw metadata I needed for keyword analysis.
Steps to process the data
The problem was the random strings of text like \\’92, which I figured were used to denote special characters. Now, if you have a brain, you would not do what I did next:
I strung together a bunch of .replace() in a list comprehension to create a new list that manually removed the unwanted characters. The output was like this:
I’m not proud of it, but it only took two minutes and it worked.
In case I wanted to analyze the numbers, I also reformatted the read_time so it would only have an integer. The current output of the parse was something like 5 min read time, and I wanted to only have 5. So I wrote in another quick list comprehension to remove the extra text and be left only with an integer value:
edited_read_time = [int(entry.replace(" min read","")) for entry in read_time]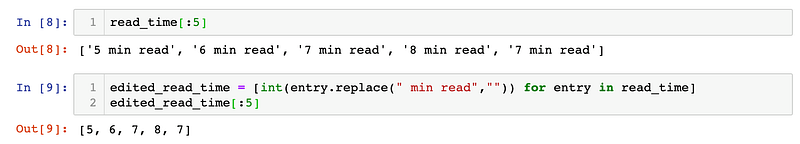
My next step was to create a pandas DataFrame by combining the lists together. All lists needed to be of the same length. Otherwise, pandas would raise a ValueError saying that arrays must all be of the same length. I was fairly certain they should already be ready to load into pandas, but just to double-check, I looked at the length of each list.

I had to fix this somehow. Part two of something I’m not proud of was me extracting the title and subtitle lists to Excel. There was only one missing, so I thought it wouldn’t take too much time. I put the lists side by side and just looked for which subtitle was missing:
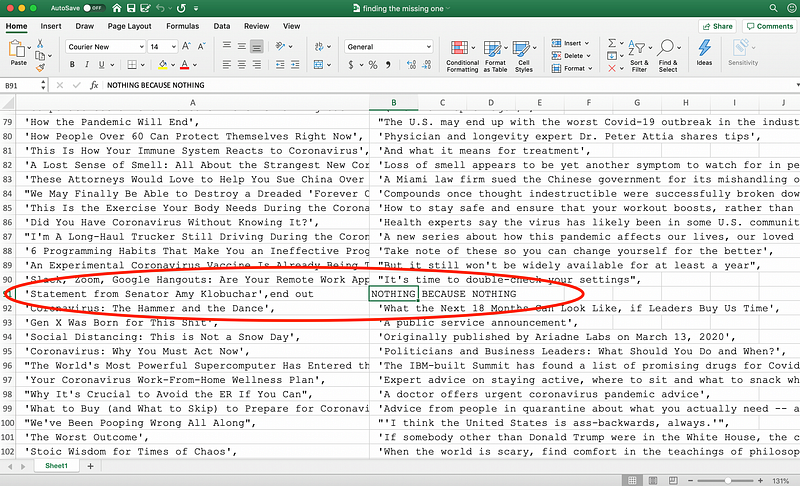
I saw that the index of the missing item was “91” (90 in Python), so I simply inserted N/A into the extracted subtitle list:
edited.subtitle.insert(90, 'N/A')Now, all the lists were aligned. To create the DataFrame, I made a dictionary that specified the column names and values:
The final DataFrame output looked like this:
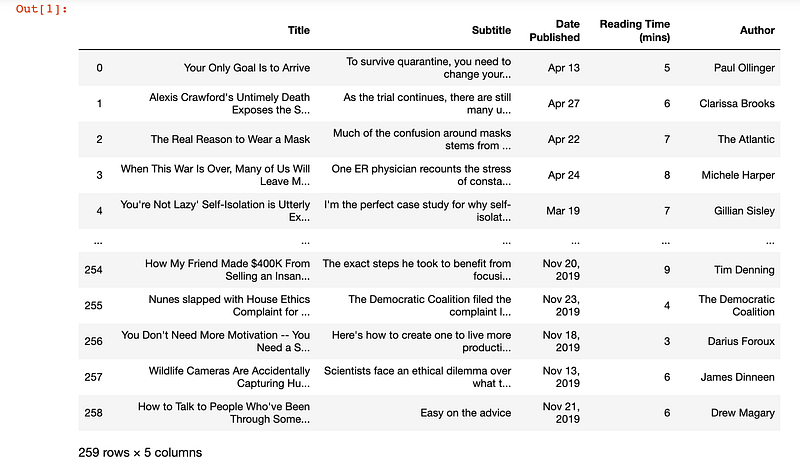
Wonderful! Now I could begin with the analysis.
Almost. I worked on this project over two days, and on the second day, I noticed that there had been one more article added to the Popular page. I wanted to include it in my data set, so I just inserted it manually:
Now, the data set was complete and I could begin my analysis.
Recap
To sum up the data collection and processing:
- Save local HTML copy of the Medium Popular page.
- Parse HTML with
lxml etreeXPath selectors. - Process the data by removing extra characters, filling missing data, and adjusting the reading time to integer values only.
- Combine all extracted lists of metadata into one pandas DataFrame.
You can now check out Part 2 on the data analysis and visualization with Pandas and Tableau!


