
How Curvenote is a game changer for academic authoring big time!
… What is Curvenote and why it is a “game-changer”
[Declaration and disclaimer: I am a mere user of Curvenote, and I DO NOT benefit in any way by writing about Curvenote. I have no financial or other interest. Besides, I am writing this on the basis of the current version of Curvenote. Your experience may be different]
One day I was surfing the web lazily searching for “explorable explanations” — that style of authoring where you write complex thoughts in ways your readers intereact and play with. By the by, I came across a post someone wrote (I lost track of that post now, but …) with something like, “Have you tried Curvenote?”
I hadn’t, so I decided to visit the site and check out what was the deal. Here is the website:
I went for explorable explanations, I stayed for the revolution they will bring in how we write papers (think of term papers, essays, reports, articles, books, data driven documents, data science papers, journal articles, you name it). In this post, I am going to show you some features and why I am mighty excited about its prospect. Everything on that site is free of course, they discuss everything openly on their Slack Channel, and there is even a blog post written about their publishing model here:
They say in their blog:
We are starting Curvenote because we believe that the introduction of tools and platforms that provide feedback loops between working and sharing will accelerate the speed of scientific discovery. We believe that the feedback loops connecting discovery and communication will promote collaborative evolution of ideas and ultimately increase the relevance and pace of scientific breakthroughs.
That is the dream anyways
How Curvenote couples Jupyter Notebooks with its content authoring interface
Ok, in a nutshell, what is it and why is it going to be a game changer? Check out for yourself:
First, it couples your Jupyter Notebook (Jupyter Lab, or plain vanilla notebook) with their writing tool. So, if you have a jupyter notebook where you run your analyses, models, plots, then every “block” within that Jupyter notebook becomes embeddable as a “block” within Curvenote.
It may not be obvious how that works so let’s start with an example. Let’s say we want to analysemtcars data found here:
We start with a jupyter notebook (I am going to use Google Colab notebook to keep things simple). Curvenote has a Chromium Browser add-on where you can link your jupyter notebook “cells” with your Curvenote account and automatically version control your cells and the “blocks” within Curvenote.
In the Google Colab notebook, I have created a simple set of analyses and visualisations, like so:
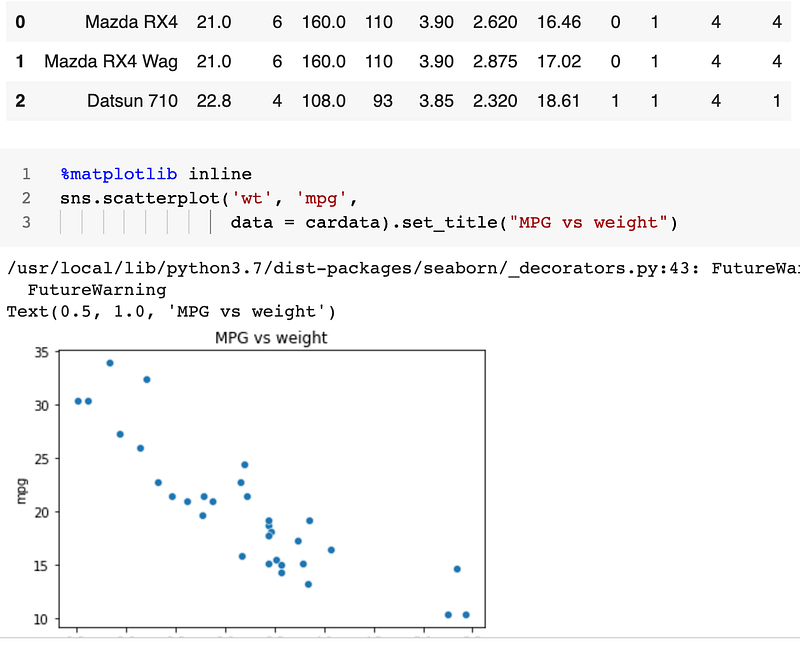
You can see that there are three “blocks” there if you will, from top to bottom:
- A table
- A code “cell”
- A plot
We will now download the ipynb notebook and store it in our Curvenote project and start a new document. Let’s start a new project, store the ipynb file from Google Colab and start a new “article” within our project.
So within Curvenote, it looks like this:
The magic of versioning a document
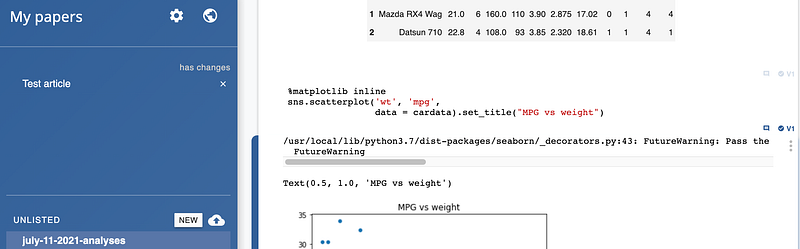
Let me walk through, from top to bottom in the left hand side blue coloured panel:
- We have the “Test article” we are working. The test article is a first class authoring environment. We can write using markdown and everythinge gets instantly converted to rich text and shows up.
- The “july-11–2021-analyses” is the
ipynbfile we just uploaded. - To the right hand side, you can see the contents of the ipynb file is loaded, but now each cell and the accompanying “evaluated blocks” are assigned a block that can be imported in the “Test article” and that’s where the magic happens.
- We can import any block we want there. We can leave all other blocks in the ipynb article that we do not want to show
So, when I am working on the main article, I can write something that looks like:
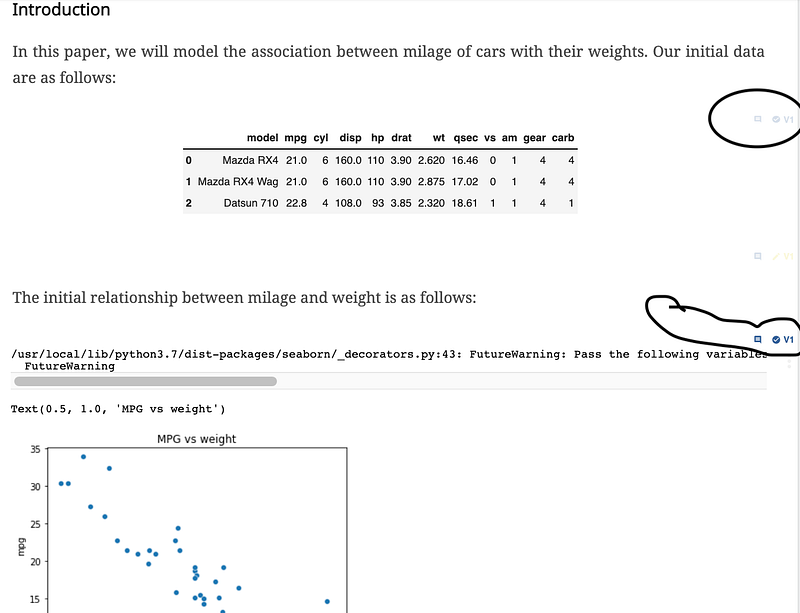
This is where it gets interesting.
See the marked sections on v1 for the tables and the figures there? These blocks are all versioned. So, different authors can work on different versions of the blocks, and the blocks in turn make an article that itself can be version controlled. This “tapestry” of version control allows for multiple authors to work on the same document adding figures and text and everything else that makes non-fiction writing so much more intuitive.
Curvenote lets you write dynamic interactive documents!
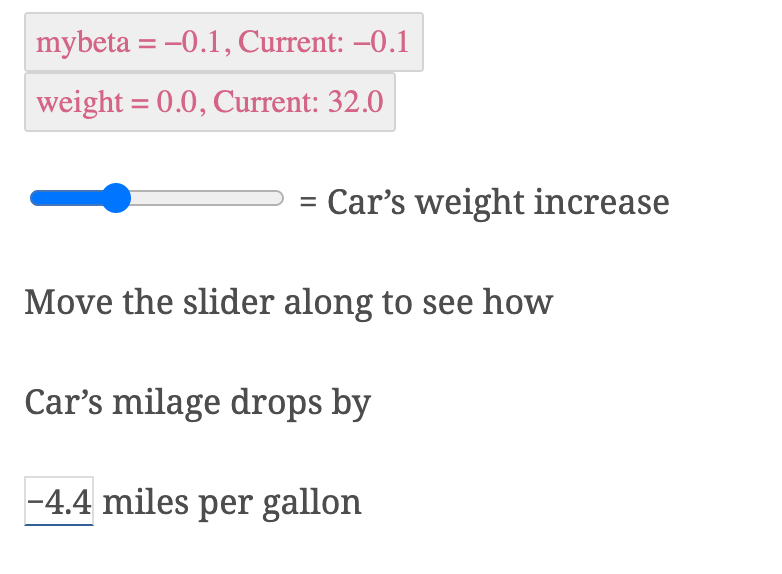
Yet Curvenote is more than just for static text authoring and exporting to $LaTeX$. I can write dynamic text within Curvenote that changes its values depending on input. Let’s say I ran a regression model with the data and now I wanted to predict the miles per gallon based on weight of a car that I derived from the regression model. Let’s say we found the beta to be about 0.1 so that as car’s weight increases by 1 kg, the milage in terms of miles per gallon of the car drops by -0.1 mile per gallon. You can insert a slider in the document and let your reader play with the numbers easily, as shown in the figure below:
So what?
If you put these things together, Curvenote is a potential game changer.
Very basic academic authoring. — If you belong to an old school ‘paper writer’, as you do, you can use Curvenote as you have always used a word processor to write your paper. You can write as you’d normally do using any other word processor, upload bibtex to insert your references then cite them. Besides you can search directly from within Curvenote with DOI identifiers to correctly format references. When you are done with your figures and writing, export Curvenote to either $LaTeX$ or directly to a PDF using templates. That’s fine but you will miss out on the powerful game changing part of the game. So, here’s more
Slightly more advanced authoring: integrate your data driven analysis with Curvenote. — Keep your analyses in Jupyter Notebooks in any language (Julia, Python, R, Stata, almost any that allows a jupyter notebook “inferior process” to run), and synchronise between your notebook and Curvenote. Pull in your plots and tables directly from notebooks to live side by side with your basic text.
Game changer: Even more advanced authoring — keep an interactive version as a webpage and a static version as PDF. — So you start or do an interactive webpage by adding interactive charts, plots, and dynamic documentation (using sliders, calculators, etc RIGHT INSIDE your document) and publish it directly without tinkering with a single line of code, and also keep a static version as a PDF
They develop new features and troubleshoot at breakneck speed!
No doubt this project is still in active development, and after I started using it, I kept raising feature requests, bugs, and so on. There is a small (er … at the moment) but interesting group of scholars and academics who play with it and participate in weekly calls and their Slack workspace. The project is being developed in breakneck speed and they push new features every now and then, besides fixing things.
In my analysis, this is a unique niche’ productivity tool that I think will change the game of how we do explorable explanations and write academic papers.
One day!
Give it a shot!