
DS in the Real World
House price Prediction with Zillow Economics Dataset
Predictive Model with XGBoost and Linear Regression based on factors like Median Income, Number of schools, Crime Rate, Unemployment rate, Number of Hospitals and their ratings

Purchasing a house is a big decision in a person’s life and needs a considerable amount of thought and research. One would like to buy a house at the best rate and minimum risk and would like it to be the best investment for the future. Various online websites, real estate agents and realtors try to guide home buyers by letting them compare different houses available for purchase.
In this article, we are going to discuss the results obtained for a data science project for House price prediction. We are trying to predict the house prices using Machine learning algorithms XGBoost and Linear Regression considering factors such as Median income in a county, Crime rate in that county, public schools, hospitals, hospital ratings and unemployment rate in the county.
The aim of the project is to provide the best counties/areas in the USA to invest in for a national real estate developer, individual buyers, banks looking for a place to develop a new apartment building or to purchase. Another goal is to predict the house prices in a county in the next few months.
What is the predicted price per square foot of a home in a given zip code/ county in the next few months? Can we predict the price based on crime rates, schools and other information/metrics provided by Zillow for a zip code/neighborhood/county?
“Is 2020 a good year to buy a house?” and “Where should one buy a house?” are important questions. This House prediction project tries to answer these with the help of data from various sources and considering factors which affect the house prices.

Stakeholders for this kind of project will be:
a) Customers and Real Estate Agents — The real estate industry has long operated according to its own traditions, but the availability of huge volumes of data is revolutionizing the way the industry works. Big data analysis techniques are creating a new real estate market in which both customers and agents are better informed than ever before.
b) Companies — such as Zillow and Trulia can use this analysis to calculate an estimated value of the price that the home might attract based on factors like local schools, crime rates, income level, hospitals etc. and decide marketing strategy.
c) Banks — It’s not just consumers who are using big data to inform their house buying and selling decisions. Banks are also drawing on vast pools of data to predict the risk that a particular mortgage application could pose, using information about both the value of the home and the applicant’s financial situation and history. In addition, banks are also avoiding losing out on foreclosure and short sales, as big data is helping them to predict the maximum sale value that the market can bear.
Based on house prices predicted one can invest in real estate, find a county house better suited for their needs where they can buy a house. House buying and selling decision would become easier with the prediction done by this data science project.
Data Used for this Project
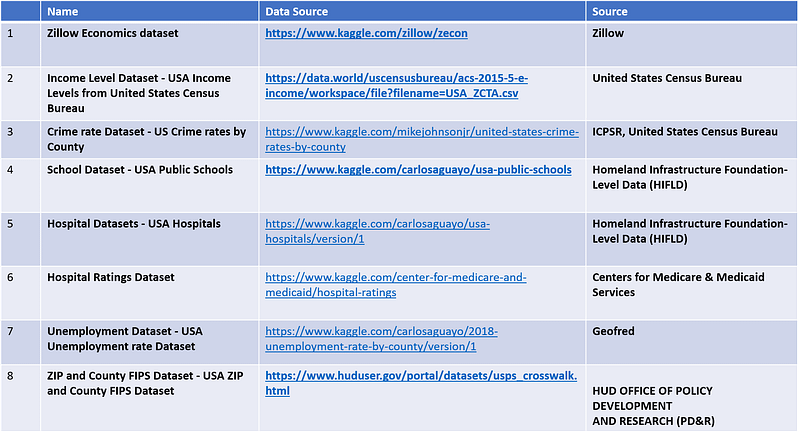
Challenges
1) Zillow Economics dataset — Difficulty in finding appropriate dataset from Zillow to work on as no description is easily available. Though Data dictionary is available it does not specify every dataset included in the Zillow Economics dataset. No details about the various csv files and how they are related to each other and the details about different attributes.
2) Did not know what is FIPS, FIPS_ST, FIPS_CT and how to relate it with counties or ZIP code
3) Finding appropriate datasets for various factors like schools, crime rate, income levels, hospital ratings, unemployment rating etc. After lot of searching found the datasets which could be used in this project.
4) Income Levels dataset has ZIP codes and no FIPS code, so I had to find a solution to convert ZIP codes to FIP codes. For this I had to search for a ZIPS to FIPS dataset and merge it with income level dataset.
5) Income level dataset — Exploring and choosing appropriate attribute of median income level to use in the project
6) How to merge all these datasets to make them one useful dataset for prediction of house prices based on factors — Income level, Crime rate, Schools, Hospitals, Unemployment rate etc.
Data Story and Exploratory Data Analysis
1. Which states should you buy a house in or rent?
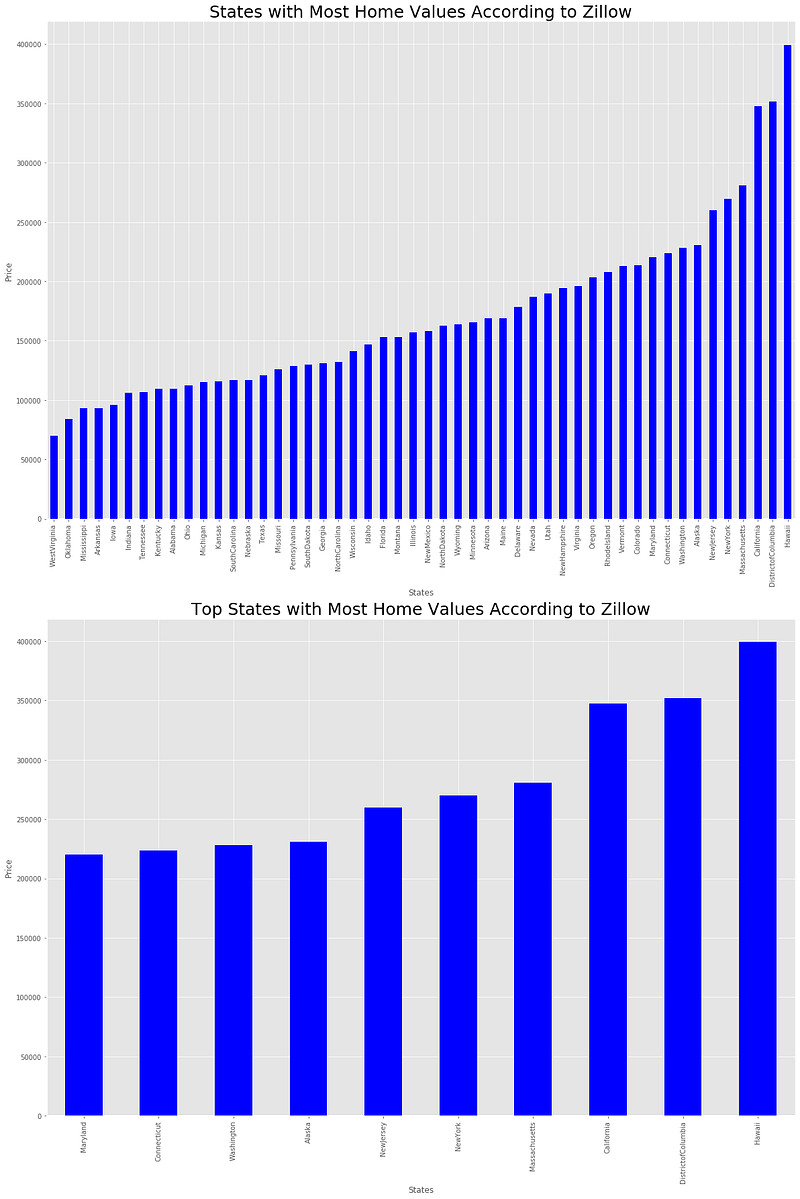
Zillow Home Value Index (ZHVI) is a smoothed, seasonally adjusted measure of the typical home value and market changes across a given region and housing type.
According to Zillow’s estimate, Hawaii is the top state with average home value close to 400K. The second most home value state is the District of Columbia with an average of 350K. Some other upper end ZHVI states are California, Massachusetts, New York, Alaska, Washington, Connecticut, Maryland and Colorado. However, the question is how has the price changed over time for these states? Because if we are looking to buy a house in one of these states, we need to know how the prices have changed over time.
2. Home value change for top expensive states
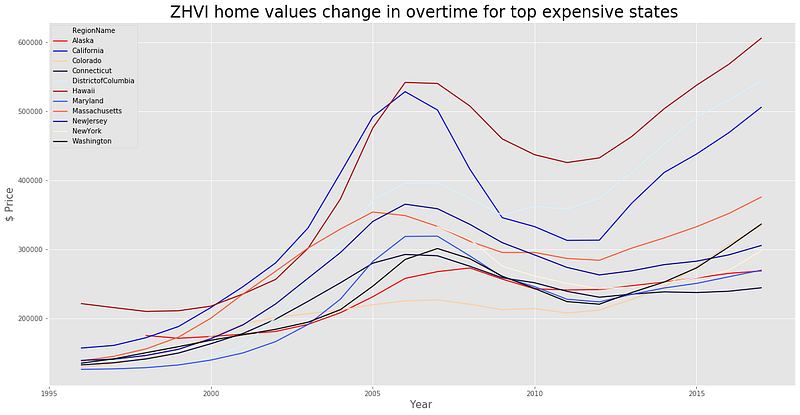
It looks like Hawaii, District of Columbia and California are in a race to increase ZHVI average since 2010 according to this dataset. Meanwhile, other upper-end states such as New York and New Jersey started slow and went slightly downhill until 2012 then prices seemed to increase with New York accelerating slightly faster than New Jersey. Colorado, on the other hand, has continuously gone uphill in this chart keeping it constant with Connecticut at around 330K in 2017.
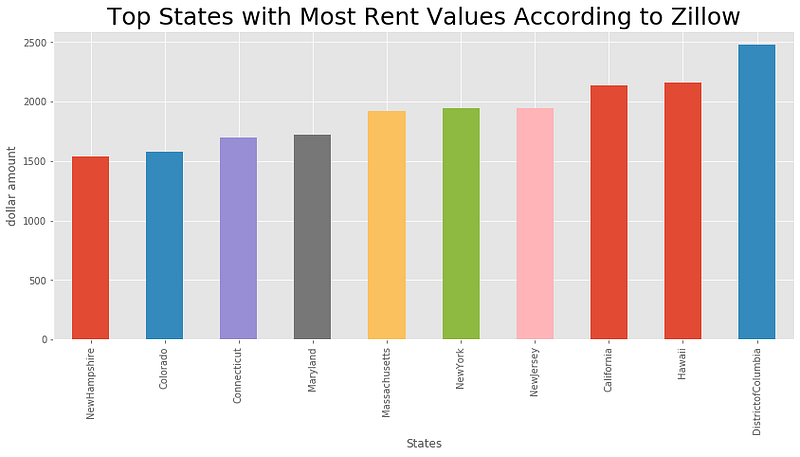
3. Top states with most Rent values
4. Median Home value per square foot in different states
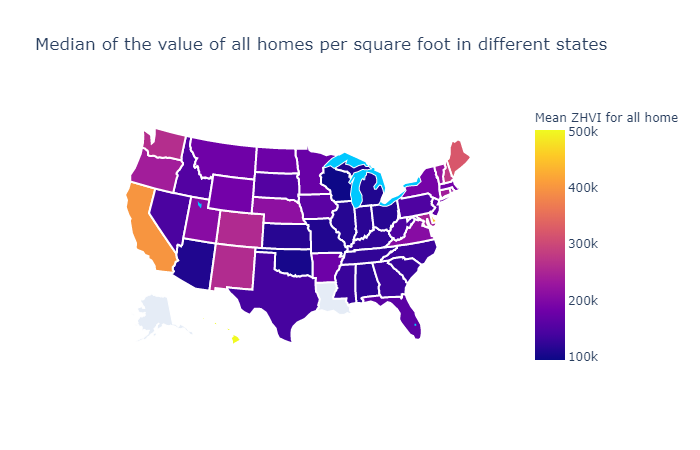
As one can see California has the highest and Wisconsin has the lowest median home value per square feet.
5. Zillow’s estimated price per square feet
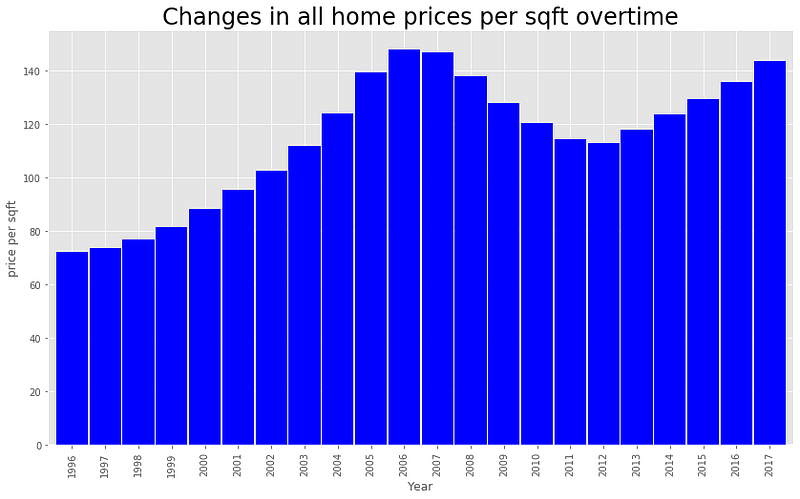
Let’s look at Zillow’s estimated price per square foot. It looks like housing price increased during 2005–2008 and decreased during 2011–2012.
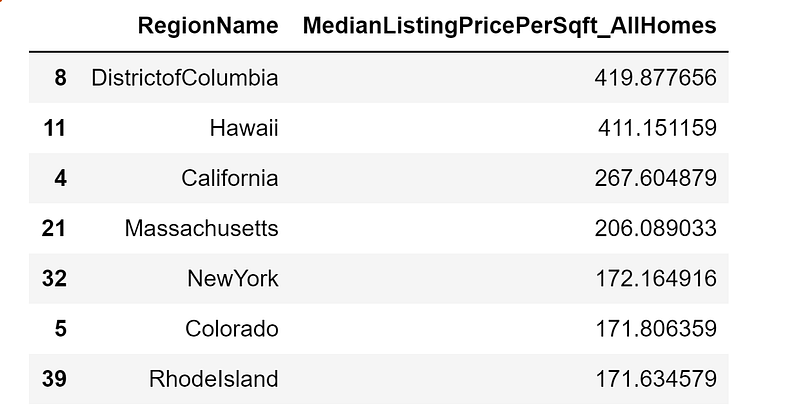
6. Top 7 States of Median Price Per Sqft
These are the top 7 states of Median Listing Price per Sqft All Homes
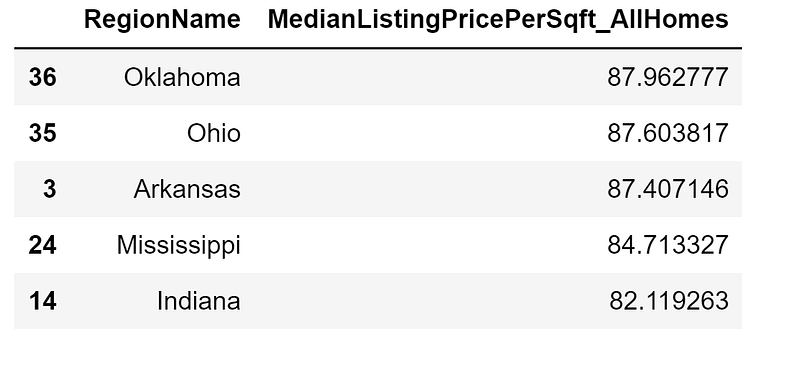
7. Bottom 5 states of Median Listing Price per Sqft All Homes
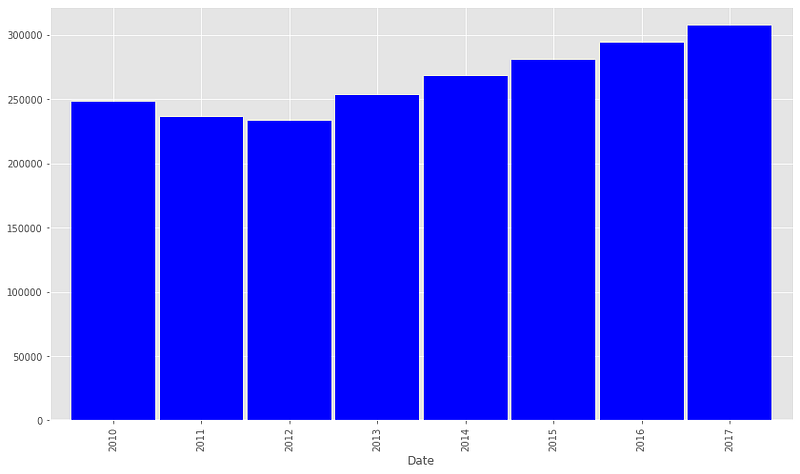
8. Median Rental Price for all homes
Median rental price for all homes has increased from 2012 to 2017 and they decreased slightly from 2010 to 2012.
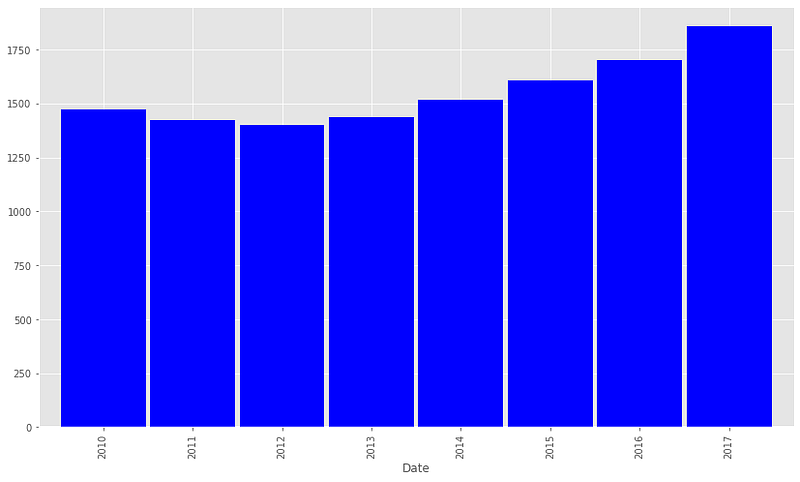
9. Median Listing Price for all homes
Median Listing prices for all homes have increased from 2012 to 2017 and they decreased from 2010 to 2012.
Predictive Model with XGBoost and Linear Regression
For building predictive model of house prices with Zillow Economics dataset, I have used County_time_series data as it provides house prices for all homes in a county. Different factors considered for predicting the house prices are Median Income, Crime Rate, Public schools, Hospitals and Hospital ratings, Unemployment rate in that county.
I have used XGBoost XGRegressor and Linear regression algorithms.
Linear Regression
Supervised machine learning algorithms are of two types — Regression and Classification. The former predicts continuous value outputs while the latter predicts discrete outputs. For instance, predicting the price of a house in dollars is a regression problem whereas predicting whether an email is spam or not is a classification problem. Python Scikit-Learn library for machine learning is used to implement linear regression.
Linear regression is a basic and commonly used type of predictive analysis. The overall idea of regression is to examine two things: (1) does a set of predictor variables do a good job in predicting an outcome (dependent) variable? (2) Which variables in particular are significant predictors of the outcome variable, and in what way do they–indicated by the magnitude and sign of the beta estimates–impact the outcome variable? These regression estimates are used to explain the relationship between one dependent variable and one or more independent variables. The simplest form of the regression equation with one dependent and one independent variable is defined by the formula y = c + b*x, where y = estimated dependent variable score, c = constant, b = regression coefficient, and x = score on the independent variable.
XGBoost
XGBoost is free open source software available for use under the permissive Apache-2 license. XGBoost stands for “Extreme Gradient Boosting” and it is an implementation of gradient boosting machines. The XGBoost is a popular supervised machine learning model with characteristics like fast in computation, parallelization, and better performance.
XGBoost is an optimized distributed gradient boosting library designed to be highly efficient, flexible and portable. XGBoost provides a parallel tree boosting (also known as GBDT, GBM) that solves many data science problems in a fast and accurate way. The same code runs on major distributed environments (Hadoop, SGE, MPI) and can solve problems beyond billions of examples [11].
The XGBoost library implements the gradient boosting decision tree algorithm. This algorithm goes by lots of different names such as gradient boosting, multiple additive regression trees, stochastic gradient boosting or gradient boosting machines.
Boosting is an ensemble technique where new models are added to correct the errors made by existing models. Models are added sequentially until no further improvements can be made. A popular example is the AdaBoost algorithm that weights data points that are hard to predict.
Gradient boosting is an approach where new models are created that predict the residuals or errors of prior models and then add them together to make the final prediction. It is called gradient boosting because it uses a gradient descent algorithm to minimize the loss when adding new models.
This approach supports both regression and classification predictive modeling problems.
Hyperparameters in XGBoost
The parameters are explained below:
- objective =’reg:linear’ specifies that the learning task is linear.
- colsample_bytree is the subsample ratio of columns when constructing each tree. Subsampling will occur once in every boosting iteration. This number ranges from 0 to 1.
- learning_rate is the step size shrinkage and is used to prevent overfitting. This number ranges from 0 to 1.
- max_depth specifies the maximum depth of the tree. Increasing this number makes the model complex and increases the possibility of overfitting. The default is 6.
- alpha is the L1 regularization on weights.Increasing this number makes the model more conservative.
- n_estimators is the number of boosted trees to fit
Metrics used
- R²- R² shows how well terms (data points) fit a curve or line.
- MSE -Mean squared error
- RMSE- Root mean squared error. It is the square root of the MSE.
- Root Mean Squared Logarithmic Error (RMSLE) -It is just an RMSE calculated in logarithmic scale. In fact, to calculate it, we take a logarithm of our predictions and the target values, and compute RMSE between them.
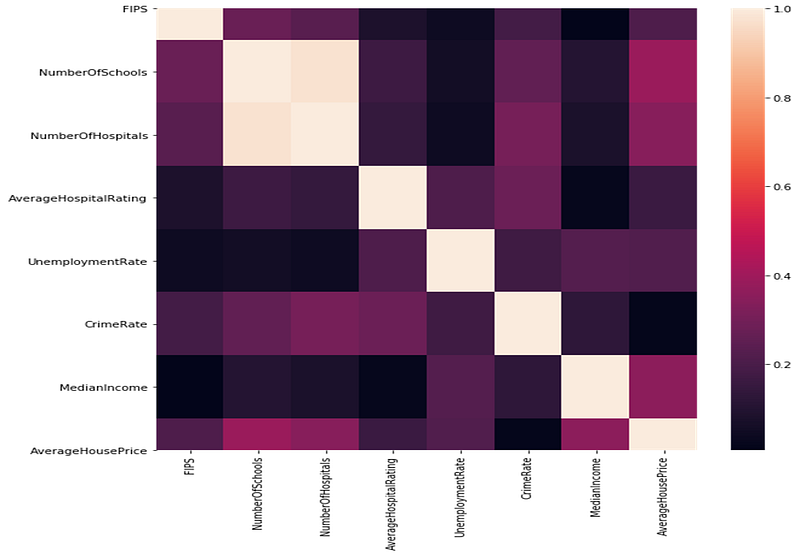
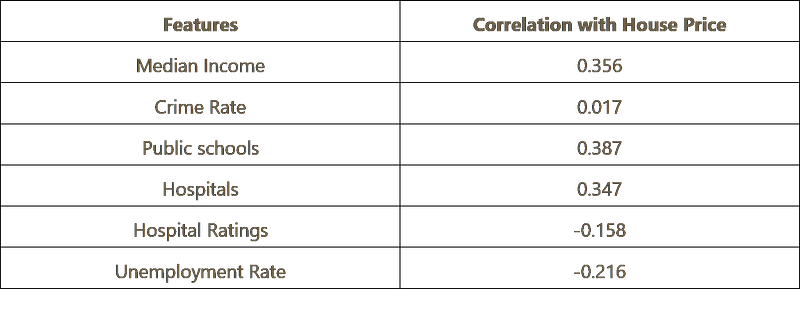
Correlation Matrix with different factors and House Price
Results: Predictive Modeling — XGBOOST and Linear Regression
I have merged 8 different datasets based on FIPS code and constructed a new dataset which is used for prediction of house prices. I use county_time_series dataset from Zillow to predict the house prices in each USA county.
Predictive model uses 80:20 train test split.
XGBoost
XGBoost prediction was tested with two sets of hyperparameters. Both results are presented here.
XGBoost Hyperparameter Set-1 Results
xgboost = XGBRegressor(objective =’reg:linear’, colsample_bytree = 0.3,
learning_rate = 0.1, max_depth = 5, alpha = 10, random_state=777,
n_estimators = 100)
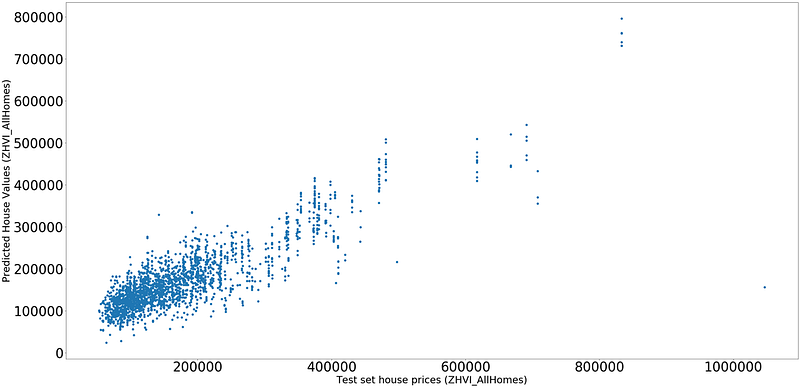
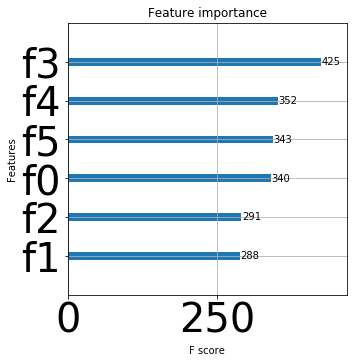
Here, f0 is number of schools, f1 is number of hospitals, f2 is average hospital rating, f3 is unemployment rate, f4 is crime rate, f5 is median income.
As seen from the above plot, unemployment rate has the highest importance followed by crime rate, median income, number of schools then average hospital rating and least important is number of hospitals in predicting the house prices.
XGBoost Hyperparameter Set -2 Results
xgboost = XGBRegressor(objective =’reg:linear’,
n_estimators=100, learning_rate=0.08, gamma=0, subsample=0.75,
colsample_bytree=1, max_depth=7)
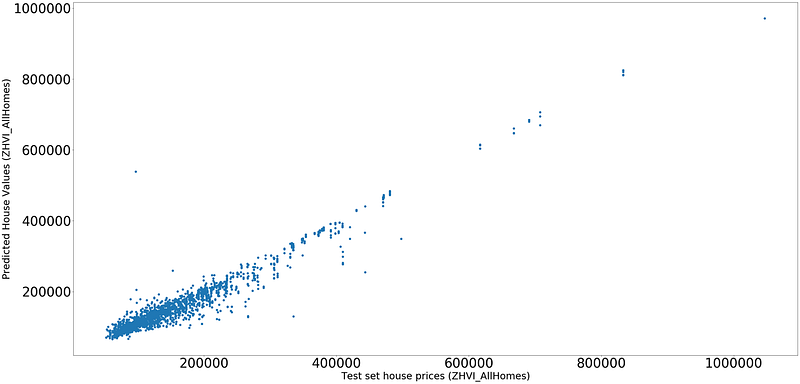
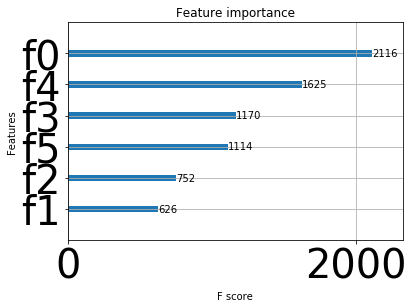
Here, f0 is number of schools, f1 is number of hospitals, f2 is average hospital rating, f3 is unemployment rate, f4 is crime rate, f5 is median income.
As seen from the above plot, number of schools has the highest importance followed by crime rate, unemployment rate, median income then average hospital rating and least important is number of hospitals in predicting the house prices.
Linear Regression Results
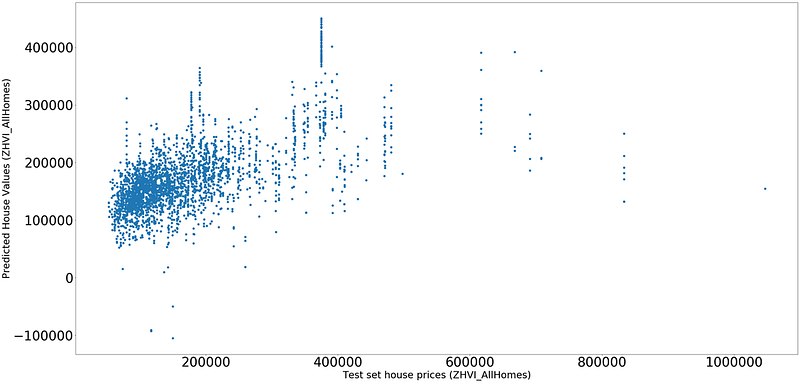
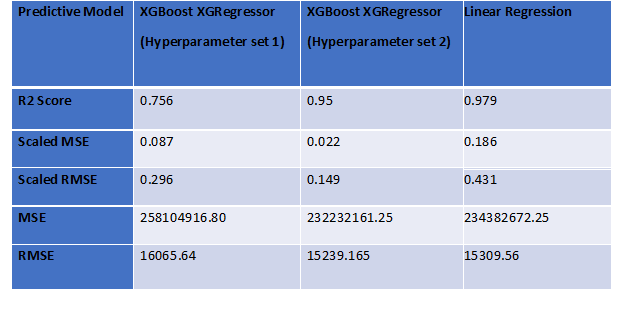
As we can see second set of hyperparameters have given better results with XGBoost compared to Linear Regression.
Next Steps
As a next step, for prediction I would like to experiment with other regression algorithms like Light GBM.
Acknowledgement
I sincerely thank my data science mentor -Dr. Ramakrishna Soma for his guidance and encouragement to complete this project.
References
1) Zillow Economics Dataset
https://www.kaggle.com/zillow/zecon
2) Crime rate Dataset — US Crime rates by County
https://www.kaggle.com/mikejohnsonjr/united-states-crime-rates-by-county
3) School Dataset — USA Public Schools
https://www.kaggle.com/carlosaguayo/usa-public-schools
4) Income Level Dataset — USA Income Levels by United States Census Bureau https://data.world/uscensusbureau/acs-2015-5-e-income/workspace/file?filename=USA_ZCTA.csv
5) Income Dataset by United States Census Bureau
https://www.census.gov/programs-surveys/acs/
6) Hospital Dataset
https://www.kaggle.com/carlosaguayo/usa-hospitals/version/1
7) Hospital Rating Dataset
https://www.kaggle.com/center-for-medicare-and-medicaid/hospital-ratings
8) Unemployment Dataset — USA Unemployment rate Dataset
https://www.kaggle.com/carlosaguayo/2018-unemployment-rate-by-county/version/1
9) ZIP and County FIPS Dataset — USA ZIP and County FIPS Dataset
https://www.huduser.gov/portal/datasets/usps_crosswalk.html
10) https://www.kaggle.com/carlosaguayo/correlation-between-house-prices-and-other-factors
11) XGBoost https://xgboost.readthedocs.io/en/latest/index.html
12) https://www.zillow.com/research/data/
13) https://whisper.realestate/blog/predictions-for-the-housing-market-in-2019-2020/
14) https://www.washingtonpost.com/business/2019/01/07/experts-weigh-what-housing-market-will-bring/
15) https://machinelearningmastery.com/gentle-introduction-xgboost-applied-machine-learning/


