
Hierarchical Clustering: Explain It To Me Like I’m 10
This is part numero tres of the Explaining Machine Learning Algorithms to a 10-Year Old series. If you read the two previous ones about XGBoost Regression and K-Means Clustering, then you know the drill. We have a scary-sounding algorithm, so let’s strip it of its scary bits and understand the simple intuition behind it. In the same vein as K-Means Clustering, today we are going to talk about another popular clustering algorithm — Hierarchical Clustering.
Let’s say a clothing store has collected the ages of 9 of its customers, labeled C1-C9, and the amount each of them spent at the store in the last month. (A super small store, but let’s just go with it.)
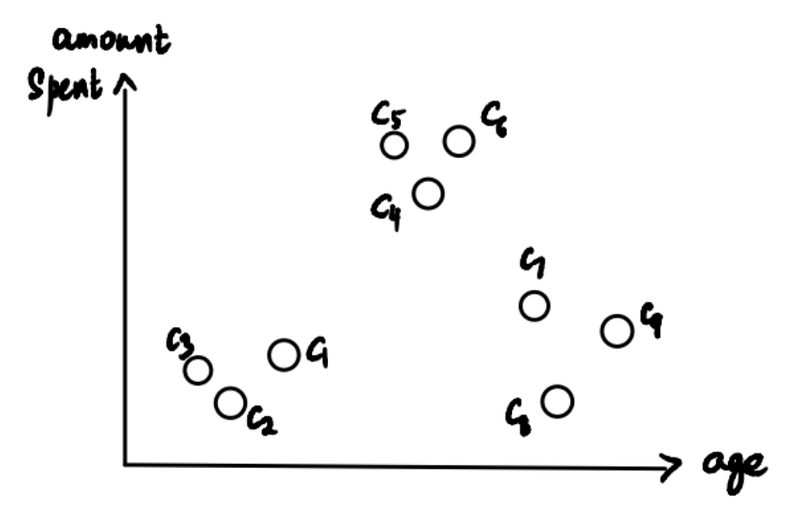
Now the store wants to identify segments or clusters of its customers to better understand them and their needs. And that’s where we data scientists, armed with Hierarchical Clustering, come in to save the day.
I’m going to divide the explanation into 3 parts:
1. Cluster Creation and Dendrograms
We start by making every single data point a cluster. This forms 9 clusters:
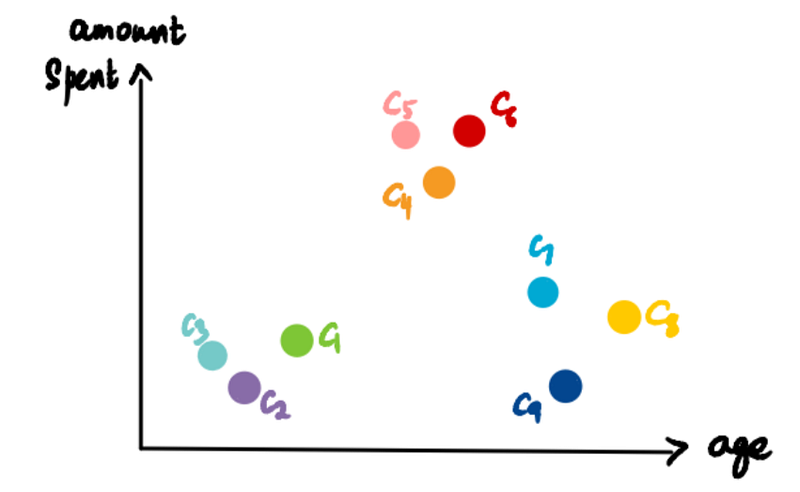
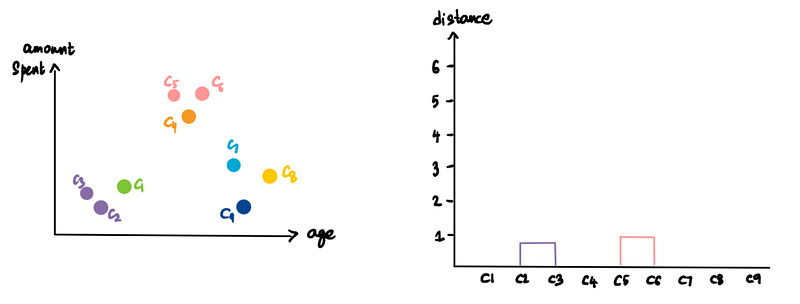
Take the two closest (more on closeness in Section 2) clusters and make them one cluster. Since C2 and C3 are closest, they form a cluster. This gives us a total of 8 clusters.
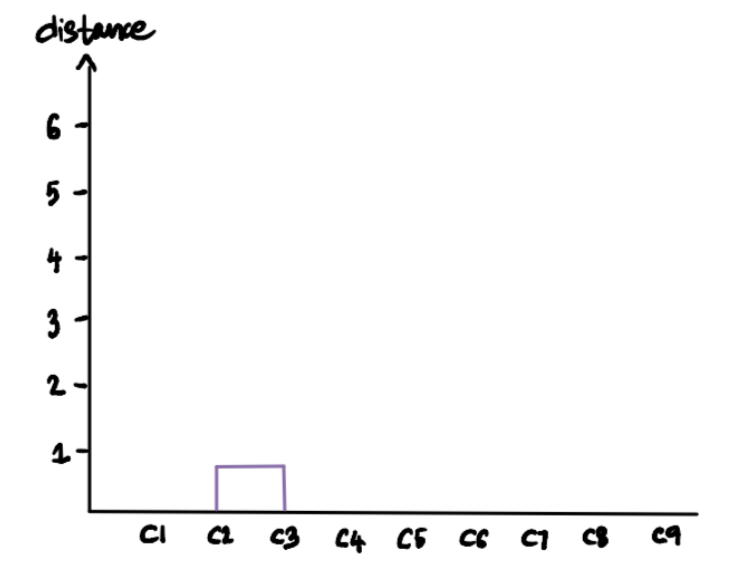
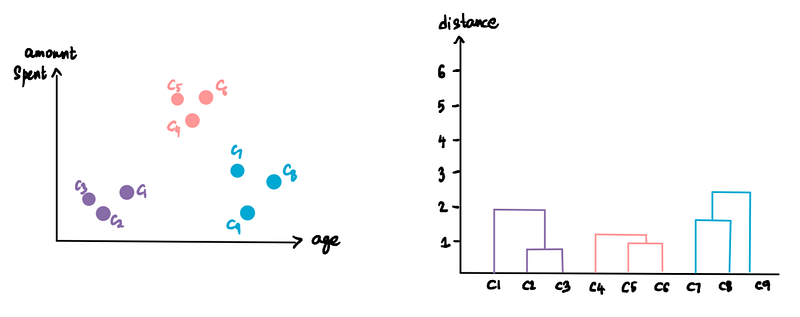
Now we represent this cluster on something called a Dendrogram. The x-axis represents the points (or customers in our case), and the y-axis is the distance between the clusters.
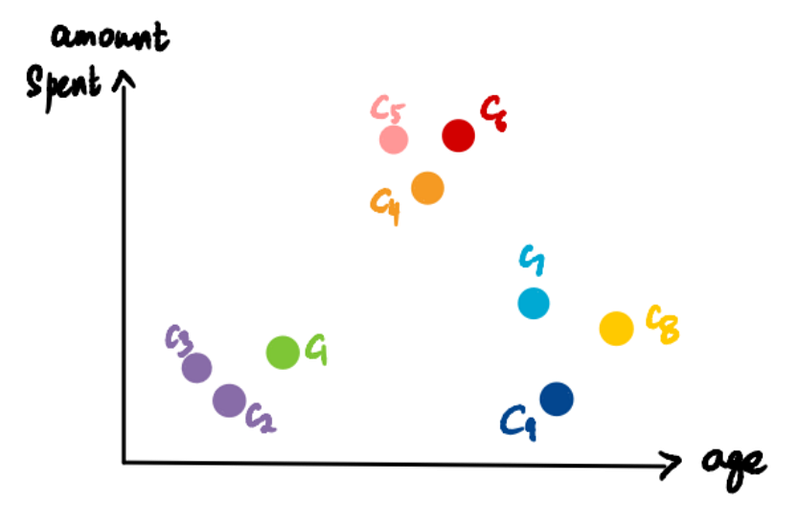
We repeat this. Take the two closest clusters (C5 and C6) and make them one cluster and plot this on the dendrogram.
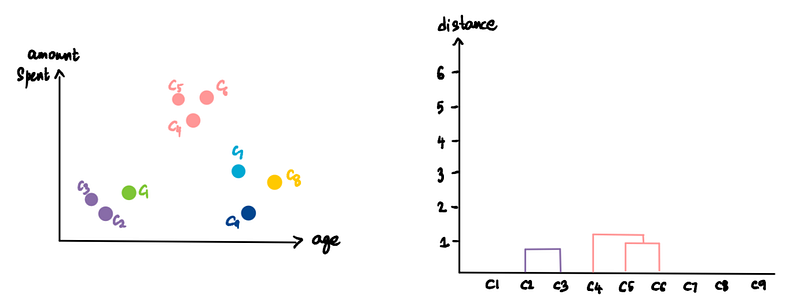
Do it again. (pink cluster and C4)
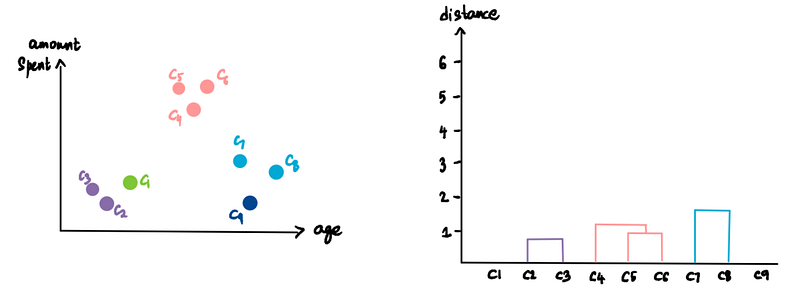
And again. (C7 and C8)
We keep repeating this process until we are left with only one cluster.
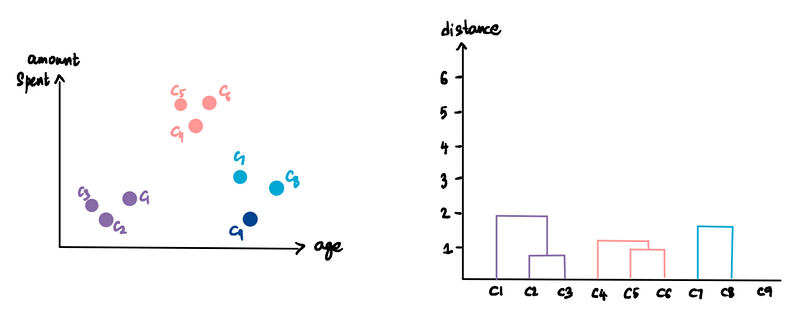
For now, that’s how we create the dendrogram and our hierarchical clusters.
2. A Discussion on Distances
Previously, we spoke about finding the closest clusters, but how exactly do we measure this closeness?
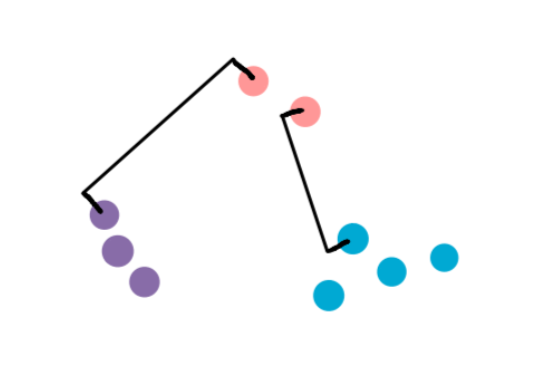
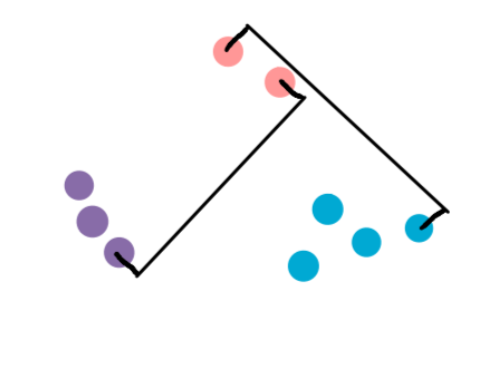
Imagine we have pink, blue, and purple clusters. And now we want to figure out if we should cluster the pink cluster with the blue one or the purple one.
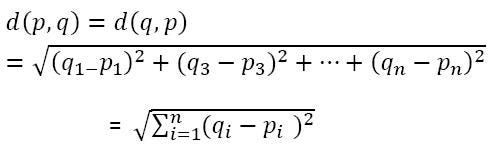
There are 4 ways of doing this. But before we talk about them, let’s briefly talk about distance. In this context, when I say distance what I mean is the Euclidean Distance. So, if p with coordinates (p₁, p₂,…, pₙ) and q with coordinates (q₁, q₂,…, qₙ) are two points in n-dimensions, then the Euclidean distance between them is:
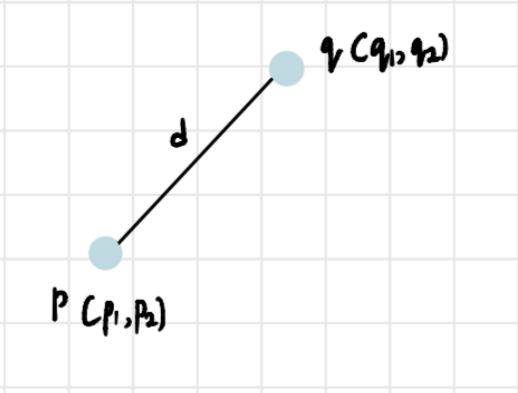
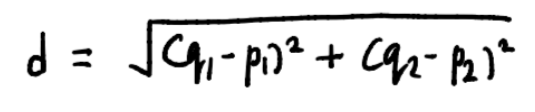
In our case, since the data is 2-dimensional, Euclidean distance between two points will be:
Now that we understand how to interpret distances, the 4 ways to determine closeness are:
- Single-Linkage: In the single-linkage method, we define distance as the shortest distance between two points in each cluster. So we compare the distance between the closest points in the pink and purple clusters to the distance between the closest points in the blue and pink clusters. The smaller of the two distances determines which cluster the pink one is closer to.
2. Complete-Linkage: This is similar to Single-Linkage, but here distance is measured between the farthest pair of points in two clusters.
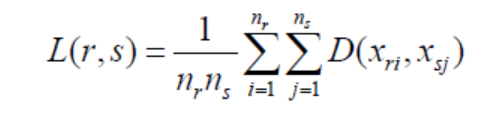
3. Average Linkage: As the name suggests, distance is defined as the average distance between each observation from the first cluster and to every observation in the second cluster. (Scary-looking formula alert! It’s here for the people interested, but what is important is that you understand the logic behind how the distance is measured.)
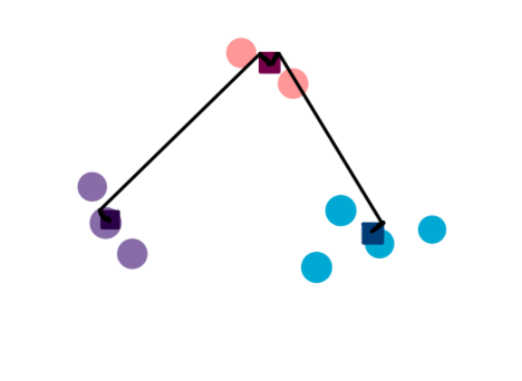
4. Centroid Method: This involves finding the center (centroid) of each cluster and then finding the distance between them. (If you’re unsure about how to calculate centroids, I explain the process here)
3. More About Clusters
Customizing Clusters
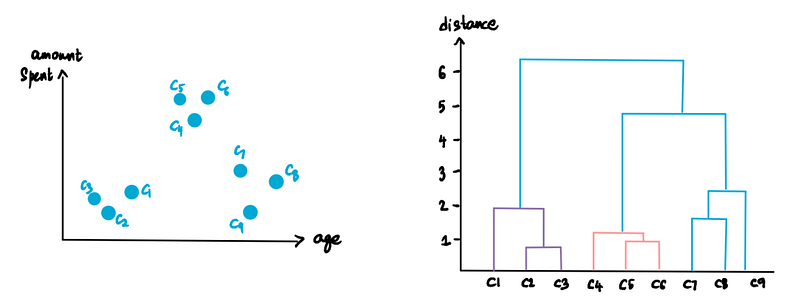
We know our final dendrogram looks like this:
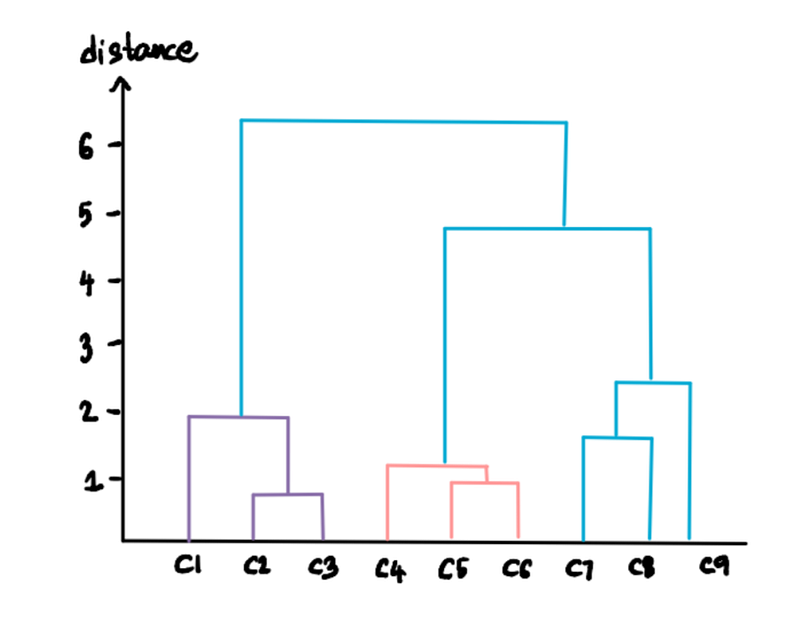
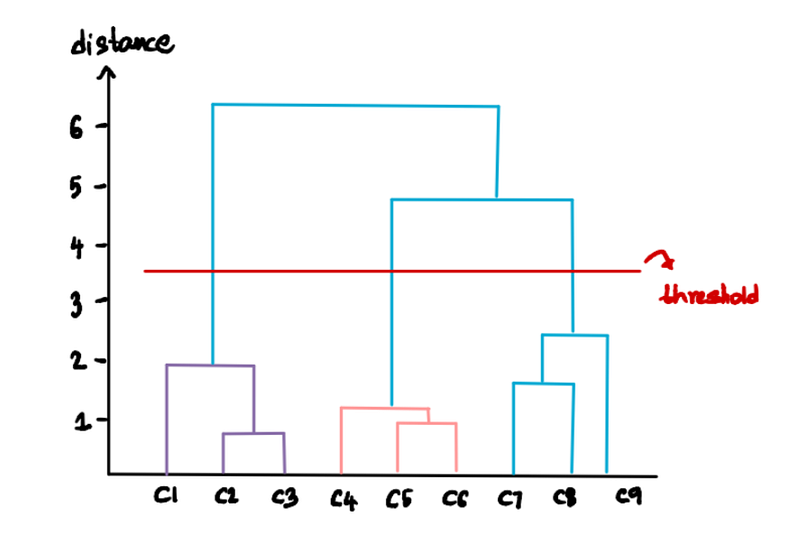
We can customize the number of clusters we want by specifying the threshold distance. For instance, say that we don't want clusters with distances greater than 3. Then we draw a threshold line at 3:
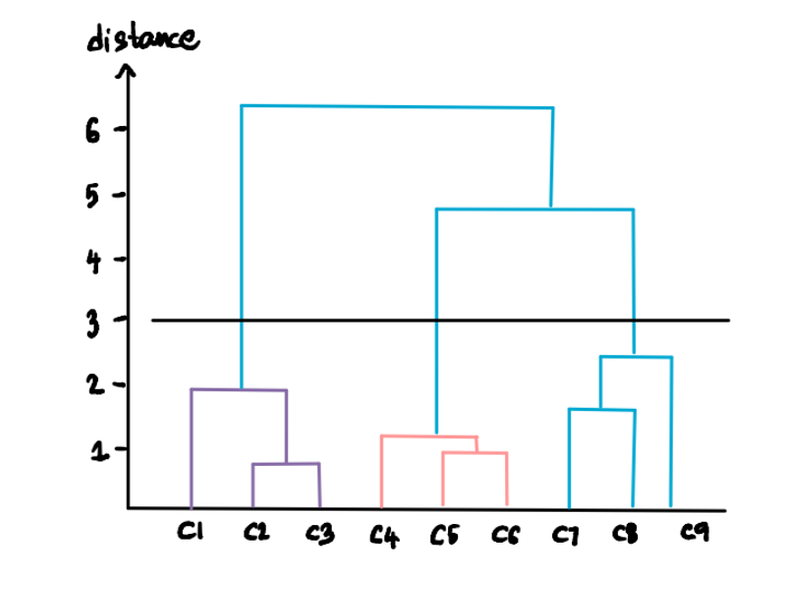
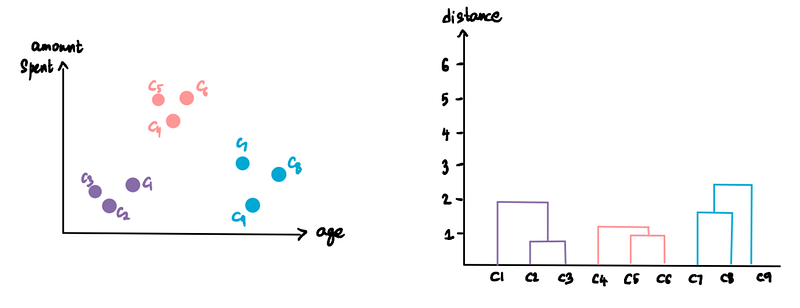
This line implies that we don't want any clusters beyond this level, so that leaves us with only the 3 clusters below the threshold line:
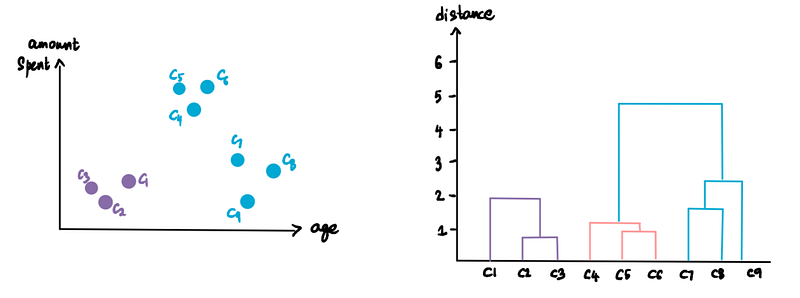
If we set the threshold distance to 5 then …
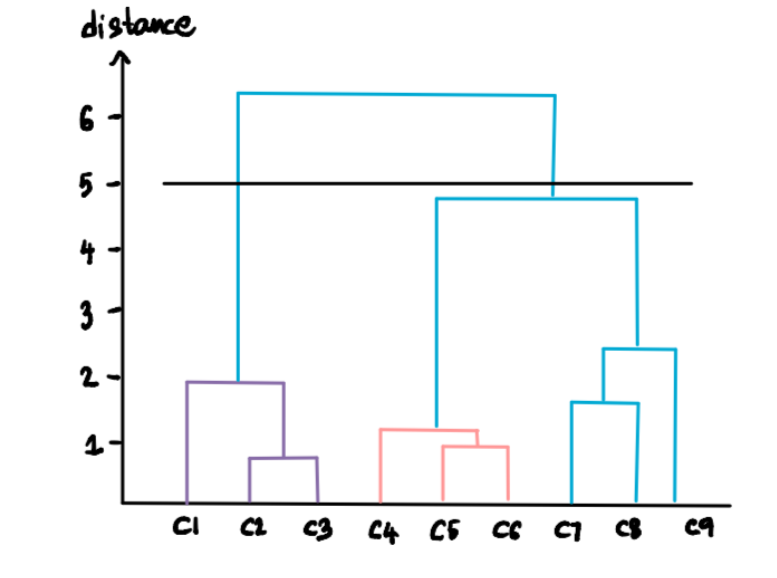
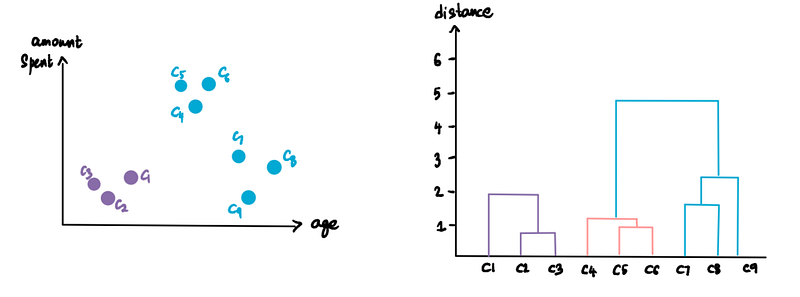
… we are left with 2 clusters:
Optimal Number of Clusters
We can figure out the optimal number of clusters is by finding the longest line that doesn’t cross any extended horizontal line. In our case, this is going to be the longest line:
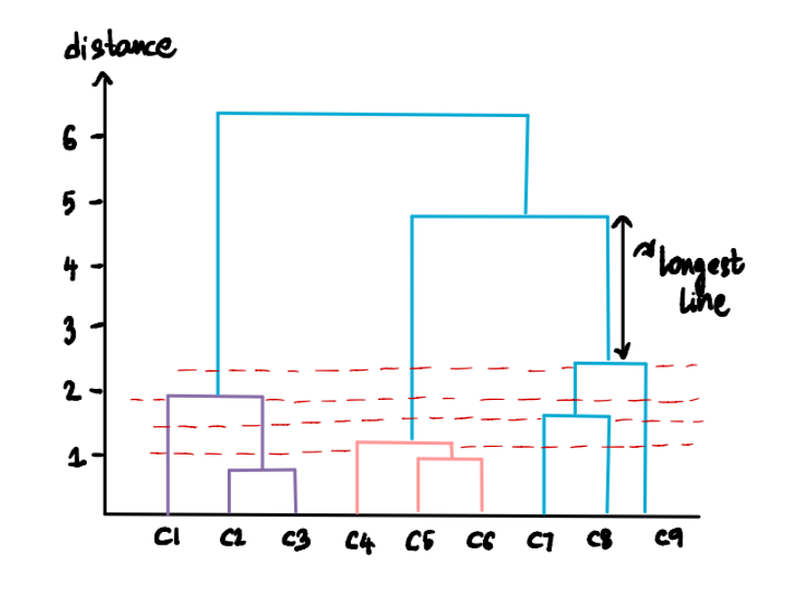
Draw a horizontal line that will cross this longest distance line and this line will be the threshold to calculate the clusters:
We have our clusters. Now what?
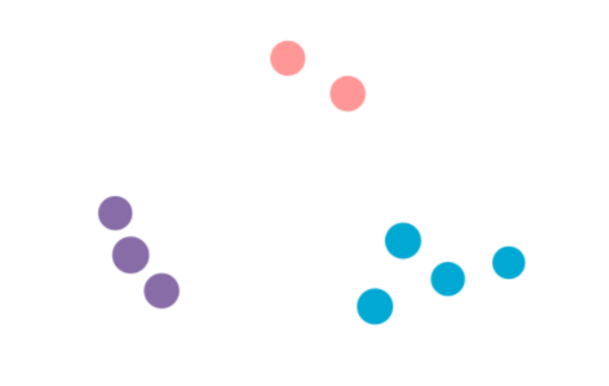
Now that we finished the clustering process and found that there are 3 optimal clusters, what insights can the store derive from this?
If you look at the clusters, we see that they fall into 3 categories — younger customers that don’t spend much, older customers with less spending also, and the mid-segment that spends a lot. The store can now use this information to their benefit. They can optimize their business by amplifying the services, products, and deals that are offered to the third segment of middle-aged customers. They can rally their resources to make this group happier — give them more choices that cater to their taste, bring in the latest products for them or even offer them exclusive shopping hours.
This is a simple example of how clustering can be used, but the possibilities are endless!
If you have any more ML algorithm suggestions or comments for me, feel free to connect with me on LinkedIn or email me at [email protected].


