
Here’s What Heap/Memory Profiling Taught Me About Memory Leaks
Walkthrough of the browser JavaScript heap and memory

As a web developer, I normally spend my days happily coding away in JavaScript (really TypeScript), blissfully uninhibited by the complexities of memory management and garbage collection that are being managed when my applications are running in the browser. Memory management? Pah, that’s for the browser to worry about!
Occasionally seemingly innocuous code changes make their way to the main and our once smooth-sailing application starts chugging like a rusty boat. Lag, unresponsive interfaces, and dreaded crashes became my unwelcome companions. So once in a while, I find myself in the mysterious caverns of the browser JavaScript memory dev tools panel.
Going back to the depths of the dev tools memory tab always takes some getting used to because it is a place I seldom need to go it always requires a refresher. Once through the refresher, I started to enjoy my time there because it quenches a thirst for knowledge with a treasure trove of insights, and secrets about my code’s efficiency or more often inefficiency, and hidden memory leaks.
Buckle up, while we go for a quick walkthrough of the browser memory panel and unearth the gold that it produces. Prepare to join me on a journey to unlock the mysteries of the JavaScript heap and memory allocation in Chrome DevTools.
What is the Heap?
The JavaScript Heap refers to a specific memory space inside your web browser dedicated to storing data used by JavaScript code. Essentially a large pool of memory specifically reserved for your running web application.
- Stores dynamic data allocated by your JavaScript code during runtime. This includes objects, arrays, functions, and any other data structures created by your script.
- Unlike variables on the stack (used for fixed-size data like numbers and strings), the heap allows flexible memory allocation based on your code’s needs.
- The JavaScript engine automatically manages the heap, allocating memory for new objects and reclaiming memory from unused ones through a process called garbage collection.
Luckily we don’t directly manage memory allocation or deallocation in your code. However, understanding how the heap works can help you write more efficient and performant JavaScript code.
We can break the space into three sections
- Live object: Objects currently in use by your code and occupying space in the heap.
- Dead objects: Objects no longer needed by your code but haven’t been reclaimed by garbage collection yet.
- Free Space: Unused memory available for allocating new objects.
What can we do with this information?
- understanding how the heap works allows us to manage efficient memory which directly affects performance and stability.
- Memory leaks, where objects are unintentionally held onto even when no longer needed, can lead to memory exhaustion, slowdowns, and eventually crashes. (this is what drove me to write this today)
The JavaScript heap plays a vital role in managing memory for your web applications. By understanding its purpose, management strategies, and components, you can become a more informed and responsible developer, writing efficient and performant code that delivers a smooth user experience.
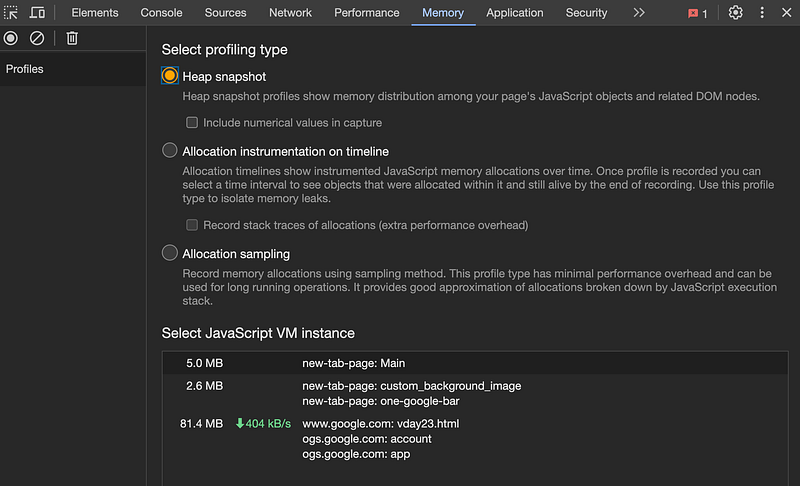
How We Use the Memory Tab To Analyze Our Memory Usage
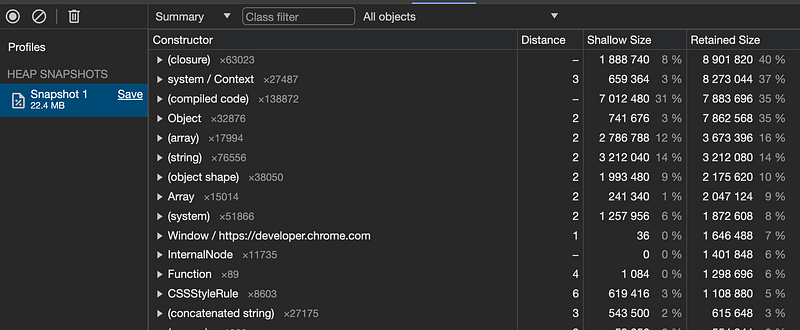
Heap Snapshot
- Enables you to capture a snapshot of the entire JavaScript heap at a specific point in time. It’s like taking a picture of memory usage, including all live objects and their relationships.
- Compare snapshots across different application states to identify memory leaks.
- Analyze the overall distribution of memory used by different object types.
- Inspect individual objects and their properties to understand why they might be holding onto unnecessary data.
Interact with it! Take snapshots at different stages of your application’s workflow to compare memory usage and identify potential leaks. Click that “Take snapshot” button like there’s no tomorrow!
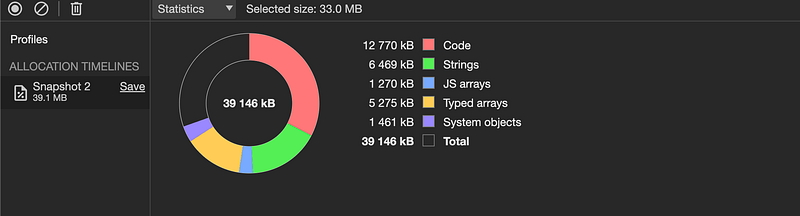
Allocation instrumentation on timeline
This option offers a powerful way to analyze memory usage in your web applications. It combines aspects of both Heap Snapshots and Allocation Sampling, providing a detailed view of memory allocation and deallocation events alongside a timeline of your application’s execution.
- It records both snapshots of the JavaScript heap at regular intervals and information about every object allocated and deallocated between those snapshots.
- Creates a visual timeline with markers indicating memory allocation events (objects created) and deallocation events (objects released).
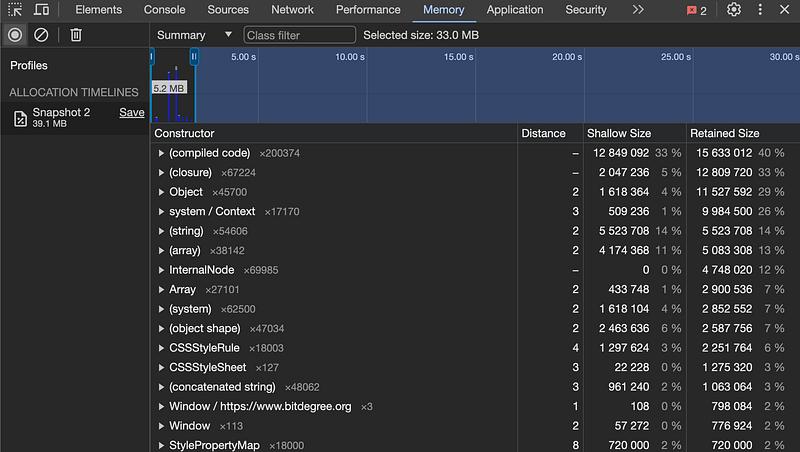
- See how memory usage changes over time during specific user interactions or code execution.
- Analyze the effectiveness of garbage collection cycles in cleaning up allocated memory.
- Offers a clear visual representation of how memory changes over time, making it easier to identify potential issues.
Overall, the Allocation instrumentation profile type is a valuable tool for gaining deep insights into your application’s memory usage and identifying potential memory leaks. It’s particularly useful for complex applications or situations where understanding the memory changes is crucial.
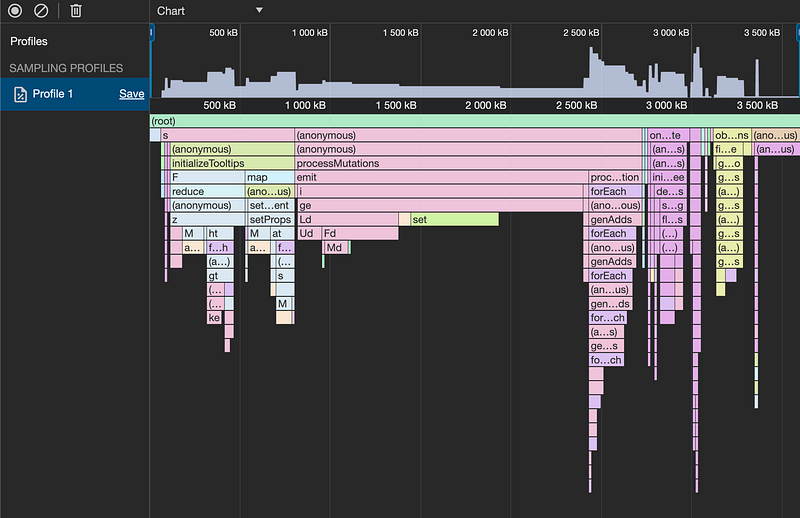
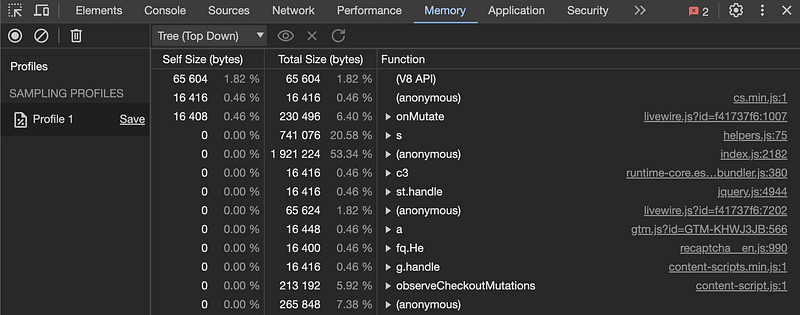
Allocation sampling
profile records information about every newly allocated JavaScript object during a specific period of your application’s execution. It doesn’t capture a snapshot of the entire heap like other profile types but instead focuses on tracking memory allocation patterns over time.
- Identify Memory Hotspots: It helps you pinpoint the functions or code blocks in your application that are responsible for the most memory allocation. This lets you understand which parts of your code are contributing the most to overall memory usage.
- Analyze Memory Changes Over Time: By collecting data over a period, you can see how memory usage changes during specific user interactions or code execution. This helps you identify potential memory leaks or bottlenecks related to spikes in allocation.
- Diagnose Frequent Garbage Collection: If your application experiences frequent garbage collection cycles, allocation sampling can help you understand which code sections are generating the most short-lived objects. This allows you to optimize your code to reduce unnecessary allocation and improve garbage collection efficiency.
Additional notes on the allocation sampling profile
- Doesn’t Show Entire Heap: Unlike “Heap Snapshots,” it doesn’t capture the entire JavaScript heap at a specific point in time. This means you can’t directly identify objects that might be leaking, but only see which areas are allocating heavily.
- Can Be Resource-Intensive: Sampling a significant amount of allocated objects adds some overhead to your application’s execution. Use it judiciously for short periods to avoid impacting performance.
The Allocation sampling profile is a valuable tool for profiling memory allocation patterns in your JavaScript applications. It helps identify code areas with high memory usage, understand memory changes over time, and diagnose potential performance issues related to frequent garbage collection.
Remember, it’s not a replacement for other Memory Tab profiles like “Heap Snapshots” or “Allocation instrumentation on timeline” which offer different insights. Choose the right tool based on your specific needs and memory analysis goals.
After delving into heap and memory profiling, I’ve found that this area is an interesting and relatively comfortable place to investigate the world of memory management within JavaScript applications.
Memory leaks, are sometimes hard to even know they are happening let alone once you know it is causing a crash or slowness how to pinpoint where in an app made up of hundreds of thousands or millions of lines of code. They can plague even the most meticulously crafted codebases. Memory leaks, often caused by unintentionally retained references to objects, can lead to a cascade of issues including memory exhaustion, performance degradation, and ultimately application crashes. This underscores the critical importance of understanding how memory is allocated, used, and reclaimed within the JavaScript heap.
Armed with this knowledge, I’ve not only learned to identify and rectify memory leaks more effectively but also to architect more efficient and performant code. The journey through the browser’s JavaScript heap has been enlightening and empowering.
If you enjoyed this content and would like to support me in these endeavors please visit: https://ko-fi.com/jacobmacinnis.
In Plain English 🚀
Thank you for being a part of the In Plain English community! Before you go:
- Be sure to clap and follow the writer ️👏️️
- Follow us: X | LinkedIn | YouTube | Discord | Newsletter
- Visit our other platforms: Stackademic | CoFeed | Venture | Cubed
- More content at PlainEnglish.io


