Here’s How I Create a Toggle in Powerbi
Create a Visual From Scratch?

We always try to make our reports and visualizations much better for the viewer.
There could be cases where there isn’t enough space, or we want to show two differing views easily.
That’s where a Toggle comes into play.
However, Powerbi does not have a toggle feature anywhere, but with a little creativity, I figured out a way to do that precisely.
Here’s how you can create a toggle for your following Powerbi dashboard!
Select Toggle image and Visualisations
For this example, I am going with buttons in Powerbi instead of images, but you can choose any image you like. Just make sure you find an opposing type for it, like an example below
For the sake of this example, the two visualizations I want to toggle between are just two text boxes.
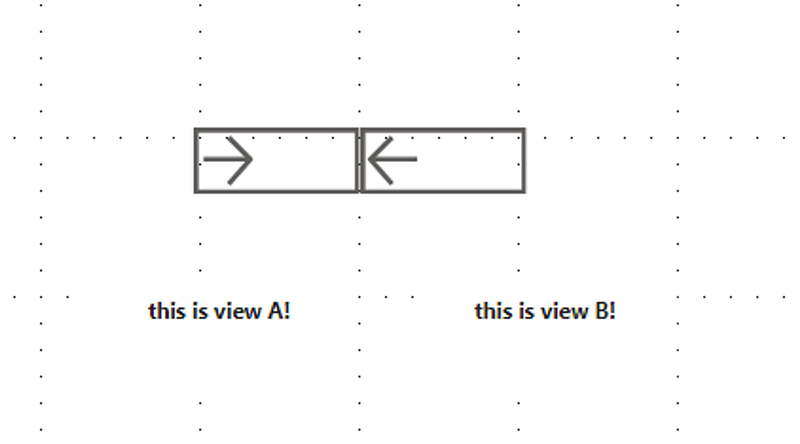
This is what it looks like Initially.
Create bookmarks
This is where the secret lies. To toggle between views, we need to create separate bookmarks.
- To do this, search for bookmarks under the search bar in powerbi.
- Then, create two different bookmarks, as shown below.
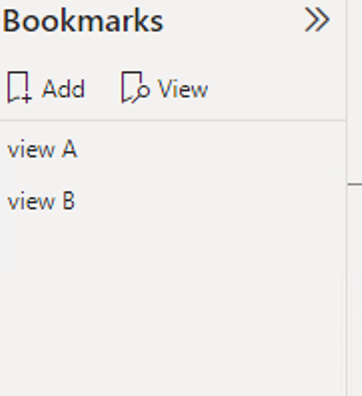
I’ve named them View A and View B for simplicity, but you can change them however you like.
Set action on button/Image
Once you have done this, it's time to set the CTAs (Calls to Action) for the buttons or images that you have selected.
- Go to the Format Pane, and under actions, select the type as a bookmark, and set each button to the corresponding bookmark.
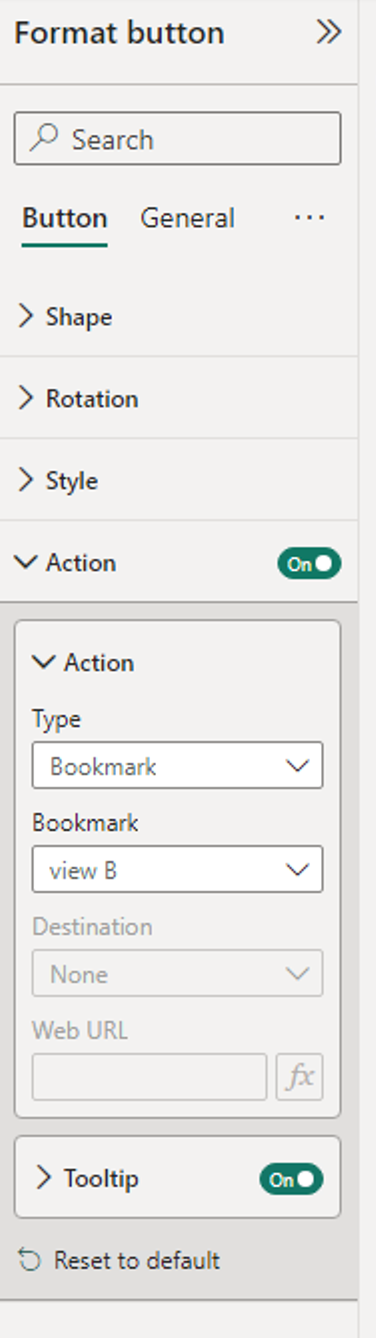
You can imagine that each button in one view should direct to the other view or bookmark.
For example, if I were to come back to the previous picture, like the one you see below, the button on the left should call for view B and vice versa.
Set the view in bookmarks
This is the most essential step.
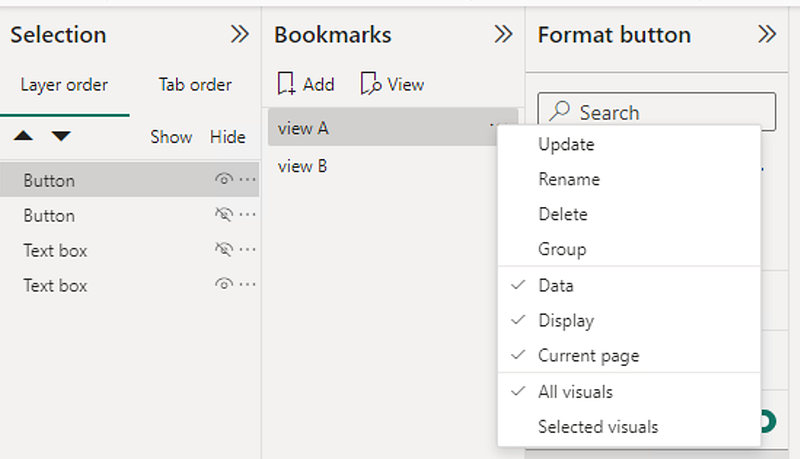
- Open the selection pane by searching it in the search bar, keeping the bookmark pane open.
- What we are doing now is to set the view for each bookmark.
You can think of bookmarks as a snapshot of one view.
- So, for the bookmark called “view A,” we only want to show view A-related metrics.
- So, in the selection pane, hide the others that are not needed.
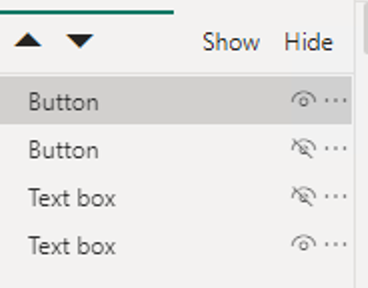
- To hide the visual, click the eye icon.
- Then, under the bookmark pane, click on the three dots next to view A and click “Update.”
- Once this is done, repeat the process for the other bookmark.
- You can do this by clicking on view B and hiding the other two visualizations.
- Once that is done, update the corresponding bookmark once again.
And there you have it!
You should now have a functioning toggle function in Powerbi!
I hope this helps with your next dashboard construction.
Remember to check out more of my Powerbi tips and tricks below!
Keep Going!
I occasionally write about content on data. If you like this one, do consider subscribing!


