Hands-on Guide to Create beautiful Sankey Charts in d3js with Python
The Sankey chart is a great way to discover the most prominent contributions just by looking at how individual items flow across states.
The Sankey chart is great in case you need an understanding of the flows in a system to reveal potential inefficient states in the process. The input data is similar to that of a network chart with source/target and weights but can reveal new insights into the most prominent contributions. It can be used in many use cases, such as improving the customer journey in marketing, cost analysis, energy flows, etc. The Sankey chart is part of the D3Blocks library and can be created using Python. The output is entirely encapsulated into a single HTML file for which you only need an internet browser to show the graph. Sharing and publishing is thus super easy. In this blog, I will introduce the Sankey Chart, and demonstrate with hands-on examples how to use it.
If you found this article helpful, use my referral link to continue learning without limits and sign up for a Medium membership. Plus, follow me to stay up-to-date with my latest content!
The Sankey chart is part of D3Blocks.
D3Blocks is a library that contains various charts for which the visualization part is built on (d3) javascript but configurable using Python. In this manner, the D3Blocks library combines the advantages of d3-javascript such as speed, scalability, flexibility, and unlimited creativity together with Python for fast and easy access to a broad community such as the Data Science field. Especially for this field, it is key that it should scale easily to very large data sets. Each chart in D3Blocks, such as the Sankey chart, is entirely encapsulated into a single HTML file which makes it very easy to share or publish on websites. Moreover, it does not need any other technology than a browser to publish or share the graphs. More information about the D3Blocks library can be found in this blog [1].
The Sankey chart.
The Sankey charts can be created in Python without worrying about any of the d3 javascript modules. After importing the D3Blocks library, you can set the user-defined parameters, and create the chart based on your input dataset. Behind the scenes, the Sankey module will create the colors, positions, ordering, and labels for the state and flows that are in the data set. It will also include the user-defined parameters, connects all d3 parts, and then finally transform it into a single HTML file that is stored on disk.
Reasons to use the Sankey chart.
The Sankey graph is insightful when one action follows the other across time or states. It can help to reveal potential inefficient states in the process, such as the discovery of a bottleneck in a process. Although the input with source-target-weights is similar to that of network analysis, the use of network analysis can be hard to interpret when the flows need to be analyzed. Each flow in the Sankey chart can differ in height, depending on its quantity, and therefore it becomes more straightforward to determine the most prominent or problematic states. Such segmentation makes it easy to draw conclusions from data.
Installation.
Before we go through the functionalities of Sankey, we first need to install the D3Blocks library:
pip install d3blocksInput Data Frame.
The input data is a DataFrame containing the following three columns:
- source: describes the source state.
- target: describes the target state.
- weight: describes the relative importance of flow between the source and target state.
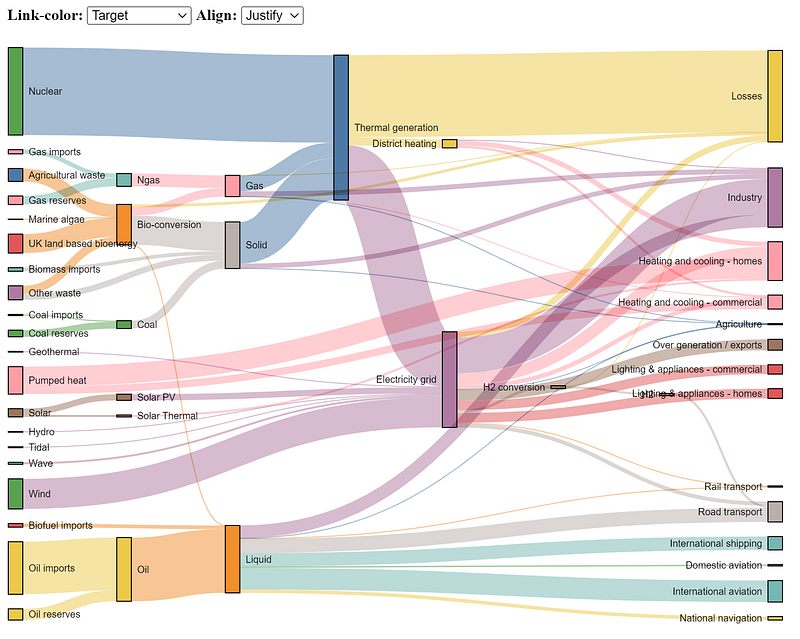
Let’s load an example of the input DataFrame from the energy dataset [2]. In this example, there are 68 rows with 3 columns. The interpretation of the weight can be seen as the strength of the relationship between source-target, which makes the width of the flow.
print(df) source target weight
0 Agricultural 'waste' Bio-conversion 124.729
1 Bio-conversion Liquid 0.597
2 Bio-conversion Losses 26.862
3 Bio-conversion Solid 280.322
4 Bio-conversion Gas 81.144
.. ... ... ...
63 Thermal generation District heating 79.329
64 Tidal Electricity grid 9.452
65 UK land based bioenergy Bio-conversion 182.010
66 Wave Electricity grid 19.013
67 Wind Electricity grid 289.366[68 rows x 3 columns]The input parameters.
The Sankey block contains various input parameters that are described in code section 1.
The output file.
The output is an HTML file that is stored on disk at the specified path. The HTML contains a full-functioning chart that can be shared and published.
Example: Translating data into Sankey chart.
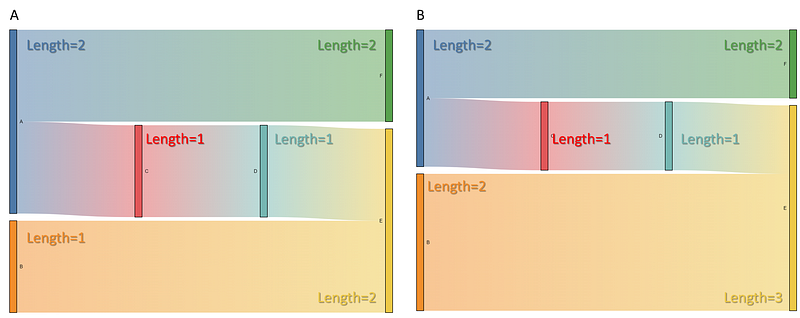
Let’s start with a small example demonstrating how the input data is translated into the chart. A data frame is created in the underneath code section with 5 relationships, each with weight=1.
The chart in Figure 1A shows the five expected flows between the source and target states with all states having weight=1. This indicates that all states have equal lengths. However, states A (blue) and E (yellow) have twice the vertical length compared to the other states. This is because state A is listed twice as a source state(A>F and A>C), and state E is listed twice as a target state (B>E and D>E) in the data frame. Let’s change the weight for state B and find out what happens. If we set weight=2 for state B (orange), the strength of the flow doubles (from 1 to 2), and the length of state B becomes twice the vertical length as it was before (Figure 1B, orange state). In addition, the vertical length for state E also increases because the flow strength increased between the state B>E. Or in other words: The vertical length of a state is the number of times a specific source/target state is seen, plus the weight. Note that the state counts and weights are normalized and relative to each other. I will load the Energy data set in the following section to create the Sankey Chart.
Example: Energy dataset.
Here we will create the Sankey chart using the Energy dataset. As described previously, the dataset contains 68 source-target rows. When we run code section 1, the following chart is created:

The flow between the entire data is organized with all the states and can now reveal new insights into the most prominent contributions or bottlenecks. Some states may be worth further investigation as it becomes aberrant what the total contribution is per state.
Final Words.
To summarize, I demonstrated how the create your own Sankey chart using Python and d3js functionality. The chart is developed in such a manner that it can handle various data sets and allows interactively changing colors, ordering, and positioning of the states. The Sankey chart is one of the blocks in D3Blocks where d3-javascript forms the basis. The use of d3-javascript has many advantages, such as speed, and flexibility, and you don’t need any other technology than a browser to plot the graphs. Feel free to play around with the library!
Be safe. Stay frosty.
Cheers, E.
If you found this article helpful, use my referral link to continue learning without limits and sign up for a Medium membership. Plus, follow me to stay up-to-date with my latest content!
Software
Let’s connect!
References
- Taskesen, E, D3Blocks: The Python Library to Create Interactive and Standalone D3js Charts. Medium, September 2022
- observablehq.com, Energy dataset, 2019 (ISC license)


