
Handling missing values in dataset — 9 methods that you need to know

While working with data it is a common scenario for the data scientists to deal with missing values. Handling these missing values could be very important as most of the machine algorithms do not support missing values. And even though if some algorithms like KNN and Naive Bayes handle missing values the results could be skewed. Hence handling it efficiently is very important as it affects the performance of the model.
As any other exploratory data analysis method, there is no one good method that fits all. There are different approaches for different kinds of problem like — time series, ML, Regression etc. and so it is difficult to provide a general solution. In this blog we shall go through the types of missing values and ways of handling them.
Types of missing values
Missing values in a dataset can occur for various reasons, and understanding the types of missing values can help in choosing appropriate strategies for handling them.
- Missing Completely at Random (MCAR):
In this scenario missing values completely occur at random and there is no relationship between the missing data and any other values in the dataset. That is there is no pattern. We can say that the probability of data being missing is the same for all observations.
E.g., Suppose that after the customer service call ends, we would be asked to give ratings to the customer representative. Not all the customers would do this and any customer who decides to give feedback is completely random irrespective of their experience or any other factors. In this case the missing values in the feedback column would be an MCAR.
2. Missing at Random (MAR)
In this scenario, missing values do not occur at random but the pattern of missingness could be explained by other observations. That is, the likelihood of a value missing in the dataset could possibly be due to some other variables in the dataset.
For e.g., suppose a survey is taken at a dermatology clinic where the gender and their skincare routine is asked. Assume that most of the females answer the survey whereas men are less likely to answer. So here, why the data is missing could be explained by the factor, that is gender. In this case, the missing data in the skincare routine column is MAR.
3. Missing Not at Random (MNAR):
In this case, the missing values are not random and cannot be explained by the observed data. This could be challenging case as possible reason for the missingness are related to the unobserved data.
For example people having more income may refuse to share the exact information in a survey or questionnaire.
How to know if the dataset has missing values?
Missing values are usually represented in the form of Nan or null or None in the dataset.
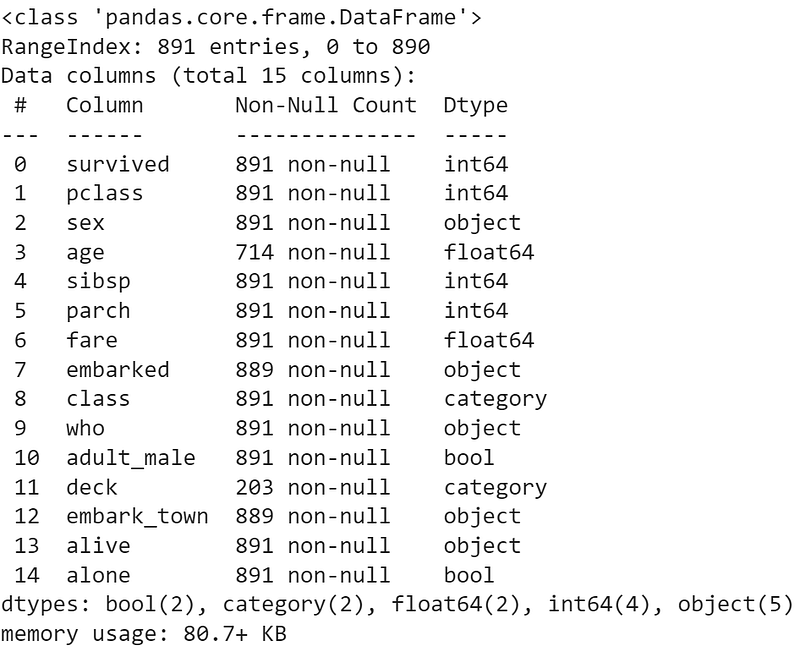
df.info()df.info() gives the names, datatype and count of non null values for all the features.
df.isnull().sum()
df.isnull().sum() gives the features name along with the count of null values for that particular feature.
What are the ways to deal with missing data?
1. Deleting the column with missing data
If a certain column has many missing values i.e., if majority of the datapoints has NULL value for a particular column then we can just simply drop the entire column.
In our example the deck column has 688 null values out of the total 891 datapoints. So more than half of the values are null and hence we can simply choose to delete the column.
df = df.drop(['deck'],axis=1)
df.isnull().sum()
No doubt it is one of the quickest techniques one can use to deal with missing data but we also have to keep in mind that there is loss of information. This technique should only be used when majority of the values in a column has NULL values.
2. Deleting the row with missing data
In this method we are deleting rows which has at least one NULL value. This is not the best practice because of the fact that data is information. Even though other values are non null we delete the entire row if there is at least one NULL value. For instance, if every row has some (column) value missing, you might end up deleting the whole data.
# Deletes the rows which has atleast one null value

updated_df = newdf.dropna(axis=0, inplace = True)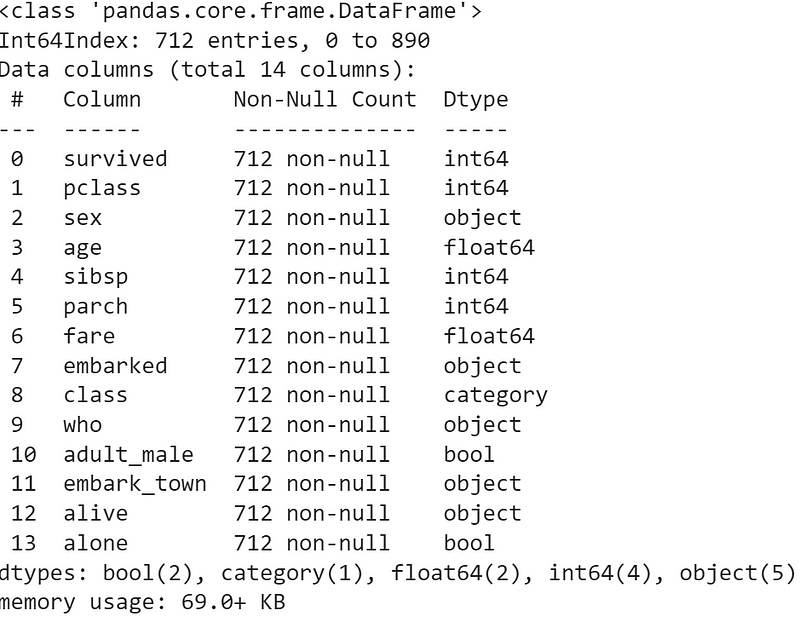
Out of the 891 rows, 177 rows has age as NULL and 2 rows with embark_town as NULL. On deletion of those rows we get 712 rows as a result.
3. Imputing missing values with mean/median
Columns in the dataset which are having numeric continuous values can be replaced with the mean, median, or mode of remaining values in the column. This method can prevent the loss of data compared to the earlier method. Replacing the above two approximations (mean, median) is a statistical approach to handle the missing values.
This approach is popularly used when there are small number of missing values in the data. However, when there are many missing values, mean or median results can result in a loss of variation in the data.
Mean and median imputation can provide a good estimate of the missing values, respectively for normally distributed data, and skewed data.
The downside of this approach is that it cannot be applied for categorical columns. Also the mean imputation is sensitive to outliers and may not be a good representation of the central tendency of the data.
df['age'] = df['age'].fillna(df['age'].mean(), inplace=True)3.1 Imputing missing values with mean/median of group
We can fill the missing values using group level statistics in the following manner.
#Mean
df['age'] = df['age'].fillna(df.groupby('class')['age'].transform('mean'))
#Median
df['age'] = df['age'].fillna(df.groupby('class')['age'].transform('median'))
In this method we have filled NULL values of age by taking the mean of age at ‘class’ group level. We are performing this method for filling the NULL values in age column assuming the fact that similar age group people would have booked particular class of tickets in the ship.
4. Imputation method for categorical columns
When missing values is from categorical columns (string or numerical) then the missing values can be replaced with the most frequent category. If the number of missing values is very large then it can be replaced with a new category.
df['deck'].value_counts()

#creating a new category 'H' as number of missing values is very big
df['deck'] = df['deck'].cat.add_categories(['H'])

df['deck'] = df['deck'].fillna('H')
In our dataset the column deck has almost 688 values which are NULL. Hence we are creating a new column called ‘H’ and substituting it with the NULL values.
5. Forward Fill and Backward Fill
Forward fill (ffill) and backward fill (bfill) are methods used to fill missing values by carrying forward the last observed non-missing value (for ffill) or by carrying backward the next observed non-missing value (for bfill). These methods are particularly useful for time-series data.
# Forward fill missing values in a specific column
df['column_name'].fillna(method='ffill', inplace=True)

# Forward fill missing values in the entire DataFrame
df.ffill(inplace=True)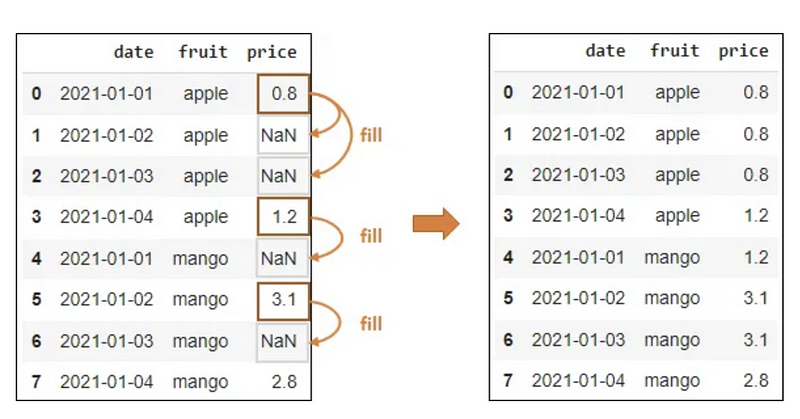
# Backward fill missing values in a specific column
df['column_name'].fillna(method='bfill', inplace=True)

# Backward fill missing values in the entire DataFrame
df.bfill(inplace=True)
If missing values should be filled with the most recent non-missing value, use ffill. If missing values should be filled with the next non-missing value, use bfill.
6. Interpolation
Interpolation is a technique used to fill missing values based on the values of adjacent datapoints. This technique is mainly used in case of time series data or in situation where the missing data points are expected to vary smoothly or follow a certain trend. It is also used in cases where it is regularly sampled data.
Interpolation can be understood as a weighted average. The weights are inversely related to the distance to its neighboring points.
# Linear interpolation for a specific column
df['column_name'].interpolate(method='linear', inplace=True)

# Linear interpolation for the entire DataFrame
df.interpolate(method='linear', inplace=True)
7. Model Based Imputation (Regression Model)
In the earlier methods to handle missing values, we do not use the correlation advantage of the variable containing the missing value and other variables.
In this method we used predictive models to impute missing values based on other features in the dataset.
The regression or classification model can be used for the prediction of missing values depending on the nature (categorical or continuous) of the feature having missing value.
Here 'Age' column contains missing values.
So for prediction of null values the spliting of data will be

y_train: rows from data["Age"] with non null values
y_test: rows from data["Age"] with null values
X_train: Dataset except data["Age"] features with non null values
X_test: Dataset except data["Age"] features with null values
from sklearn.linear_model import LinearRegression
df = df[["survived", "pclass", "sex", "sibsp", "parch", "fare", "age"]]
df = pd.get_dummies(df, columns=['sex'], drop_first=True)
df.head()
test_data = df[df["age"].isnull()==True]
traindf = df[df["age"].isnull()==False]
y_train = traindf["age"]
X_train = traindf.drop("age", axis=1)
X_test = test_data.drop("age", axis=1)
model = LinearRegression()
model.fit(X_train, y_train)
y_pred = model.predict(X_test)
test_data['age'] = y_pred8. Multiple Imputation
The Iterative Imputer is a method for imputing missing values in a dataset. It belongs to the scikit-learn library and implements the Multiple Imputation by Chained Equations (MICE) algorithm. MICE is an iterative imputation approach that imputes missing values one variable at a time, conditioned on the other variables.
Suppose the feature ‘age’ is well correlated with the feature ‘Fare’ such that people with lower fares are also younger and people with higher fares are also older. In that case, it would make sense to impute low age for low fare values and high age for high fare values. So here, we are taking multiple features into account by following a multivariate approach.
import pandas as pd
from sklearn.experimental import enable_iterative_imputer
from sklearn.impute import IterativeImputer

cols = ['SibSp', 'Fare', 'Age']
X = df[cols]

impute_it = IterativeImputer()
impute_it.fit_transform(X)
Now let’s see how IterativeImputer works. For all rows in which ‘Age’ is not missing, sci-kit learn runs a regression model. It uses ‘Sib sp’ and ‘Fare’ as the features and ‘Age’ as the target. And then, for all rows for which ‘Age’ is missing, it makes predictions for ‘Age’ by passing ‘Sib sp’ and ‘Fare’ to the training model. So it actually builds a regression model with two features and one target and then makes predictions on any places where there are missing values. And those predictions are the imputed values.
9. K-Nearest Neighbors Imputations (KNNImputer)
Imputing missing values using k-Nearest Neighbors (KNN) is a technique where missing values are estimated based on the values of their nearest neighbors in the feature space.
The idea is to find the k nearest data points and use their values to impute the missing values.
from sklearn.impute import KNNImputer
import pandas as pd

df = df[["survived", "pclass", "sex", "sibsp", "parch", "fare", "age"]]
df = pd.get_dummies(df, columns=['sex'], drop_first=True)

# Assuming df is your DataFrame with missing values
# For demonstration purposes, let's assume 'Age' is the target variable

# Separate the target variable and features
y = df['age']
X = df.drop(['age'], axis=1)

# Create a KNN imputer
imputer = KNNImputer(n_neighbors=5)

# Perform imputation
X_imputed = imputer.fit_transform(X)
Conclusion:
Each of the methods may work well with different types of datasets. We have to experiment with different techniques to check which approach works best for handling missing data in Python within your dataset. However, it is critical to understand the types of missing values in order to apply the right technique of handling them. Having domain knowledge about the dataset is also equally important, which can give an insight into how to preprocess the data and handle missing values.
References:
https://towardsdatascience.com/how-to-handle-missing-data-8646b18db0d4


