avatarGuilherme A. Franchi, PhD

Free AI web copilot to create summaries, insights and extended knowledge, download it at here

1680

Abstract

d="6efa">Let’s illustrate how to perform a partial correlation analysis using the <code>ppcor</code> package in R:</p><div id="f3c2"><pre>install.packages<span class="hljs-punctuation">(</span><span class="hljs-string">"ppcor"</span><span class="hljs-punctuation">)</span> library<span class="hljs-punctuation">(</span>ppcor<span class="hljs-punctuation">)</span>

<span class="hljs-comment"># Generate sample data</span> set.seed<span class="hljs-punctuation">(</span><span class="hljs-number">123</span><span class="hljs-punctuation">)</span> data <span class="hljs-operator"><-</span> data.frame<span class="hljs-punctuation">(</span> x <span class="hljs-operator">=</span> rnorm<span class="hljs-punctuation">(</span><span class="hljs-number">200</span><span class="hljs-punctuation">)</span><span class="hljs-punctuation">,</span> y <span class="hljs-operator">=</span> rnorm<span class="hljs-punctuation">(</span><span class="hljs-number">200</span><span class="hljs-punctuation">)</span><span class="hljs-punctuation">,</span> z <span class="hljs-operator">=</span> rnorm<span class="hljs-punctuation">(</span><span class="hljs-number">200</span><span class="hljs-punctuation">)</span> <span class="hljs-punctuation">)</span>

<span class="hljs-comment"># Compute partial correlation between x and y controlling for z</span> partial_corr_result <span class="hljs-operator"><-</span> pcor.test<span class="hljs-punctuation">(</span>data<span class="hljs-operator"></span>x<span class="hljs-punctuation">,</span> data<span class="hljs-operator"></span>y<span class="hljs-punctuation">,</span> data<span class="hljs-operator">$</span>z<span class="hljs-punctuati

Options

on">)</span>

<span class="hljs-comment"># Print the partial correlation coefficient</span> print<span class="hljs-punctuation">(</span>partial_corr_result<span class="hljs-punctuation">)</span>

<span class="hljs-string">' estimate p.value statistic n gp Method 1 0.04030392 0.5719345 0.5661525 200 1 pearson'</span></pre></div><p id="607f">In this example, we generated random data for three variables <code>x</code>, <code>y</code>, and <code>z</code>. We then computed the partial correlation coefficient between <code>x</code> and <code>y</code>, controlling for the influence of <code>z</code>. The resulting coefficient provides a measure of the relationship between <code>x</code> and <code>y</code> after accounting for the effect of <code>z</code>.</p><p id="c051">The default method was Pearson, assuming that variables x and y followed a normal distribution. Although, if this was not the case, you could opt for “Spearman” or “Kendall”, depending on the data’s distribution nature.</p><p id="f4c3">Partial correlation analysis is a valuable tool in statistics for assessing the relationship between variables while controlling for the influence of other variables.</p><p id="aac2">By accounting for confounding factors, partial correlation analysis allows researchers to obtain more accurate insights into the true relationship between variables.</p><p id="ccd9">In R, several libraries such as <code>ppcor</code>, <code>corpcor</code>, and <code>psych</code> facilitate the computation of partial correlation coefficients and related analyses, enabling researchers to conduct robust statistical analyses.</p><p id="c526">See you next time.</p></article></body>

Guide on Partial Correlation Analysis in R

Check out an easy guide to compute a partial correlation coefficient in R.

In statistical analysis, correlation measures the strength and direction of the relationship between two variables.

However, traditional correlation analysis does not account for the influence of other variables that may confound the relationship between the two variables of interest.

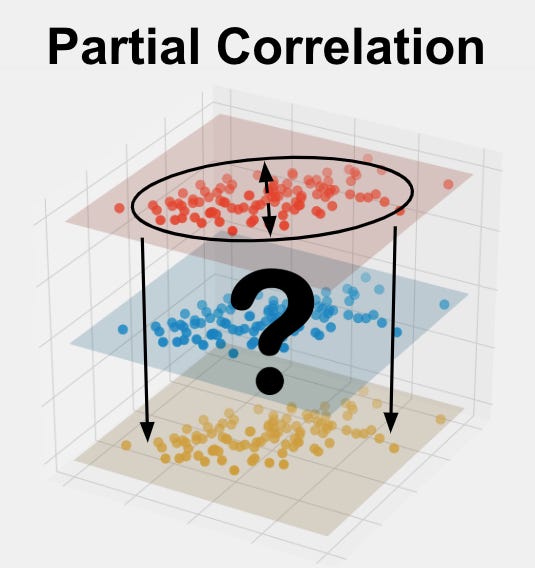
Partial correlation analysis addresses this limitation by examining the relationship between two variables while controlling for the effect of one or more additional variables, thus providing a clearer picture of the relationship between the two variables of interest.

By controlling for these confounding variables, partial correlation analysis helps researchers to better understand the true relationship between the variables under investigation.

Image retrieved from StatsTest.com

There are several R libraries available for conducting partial correlation analysis, including:

  • ppcor: This package provides functions for computing partial correlation coefficients and performing related analyses.
  • corpcor: Another package that offers functions for calculating partial correlations.
  • psych: While primarily a package for psychological research, psych also includes functions for computing partial correlations.

Let’s illustrate how to perform a partial correlation analysis using the ppcor package in R:

install.packages("ppcor")
library(ppcor)

# Generate sample data
set.seed(123)
data <- data.frame(
  x = rnorm(200),
  y = rnorm(200),
  z = rnorm(200)
)

# Compute partial correlation between x and y controlling for z
partial_corr_result <- pcor.test(data$x, data$y, data$z)

# Print the partial correlation coefficient
print(partial_corr_result)

' estimate   p.value statistic   n gp  Method
1 0.04030392 0.5719345 0.5661525 200  1 pearson'

In this example, we generated random data for three variables x, y, and z. We then computed the partial correlation coefficient between x and y, controlling for the influence of z. The resulting coefficient provides a measure of the relationship between x and y after accounting for the effect of z.

The default method was Pearson, assuming that variables x and y followed a normal distribution. Although, if this was not the case, you could opt for “Spearman” or “Kendall”, depending on the data’s distribution nature.

Partial correlation analysis is a valuable tool in statistics for assessing the relationship between variables while controlling for the influence of other variables.

By accounting for confounding factors, partial correlation analysis allows researchers to obtain more accurate insights into the true relationship between variables.

In R, several libraries such as ppcor, corpcor, and psych facilitate the computation of partial correlation coefficients and related analyses, enabling researchers to conduct robust statistical analyses.

See you next time.

R
Statistical Analysis
Data Science
Correlation Coefficient
Recommended from ReadMedium