avatarJim McAulay🍁 I'm nobody. Are you a nobody too?

Summary

The web content provides a tutorial on graphing a sine wave using Python Turtle, building upon previous lessons on equation graphing.

Abstract

The article titled "Graphing A Sine Wave With Python Turtle" is a continuation of a series of lessons on graphing equations. It introduces the concept of visualizing a sine wave, a fundamental waveform in various scientific and engineering disciplines. The tutorial guides the reader through the process of writing Python code that uses the Turtle graphics library to plot the sine wave. It includes setting up the environment, defining the amplitude and frequency of the wave, and iterating through a range of values to draw the waveform. The code provided demonstrates how to create two sine waves with different frequencies, emphasizing the importance of amplitude and frequency in the resulting graph. The article encourages readers to experiment with these parameters to gain a deeper understanding of sine wave behavior. It concludes with a quote from Jim McAulay, emphasizing the value of community and hands-on learning.

Opinions

  • The sine wave is presented as a crucial concept in multiple fields, including mathematics, physics, engineering, and signal processing.
  • The author suggests that readers should engage actively with the material by changing the amplitude and frequency to observe different sine wave patterns.
  • Jim McAulay's quote implies that both community support and practical, hands-on experience are essential for effective learning, drawing a parallel between raising a child and the educational process.

Graphing A Sine Wave With Python Turtle

A further lesson on graphing equations

source screenshot my computer

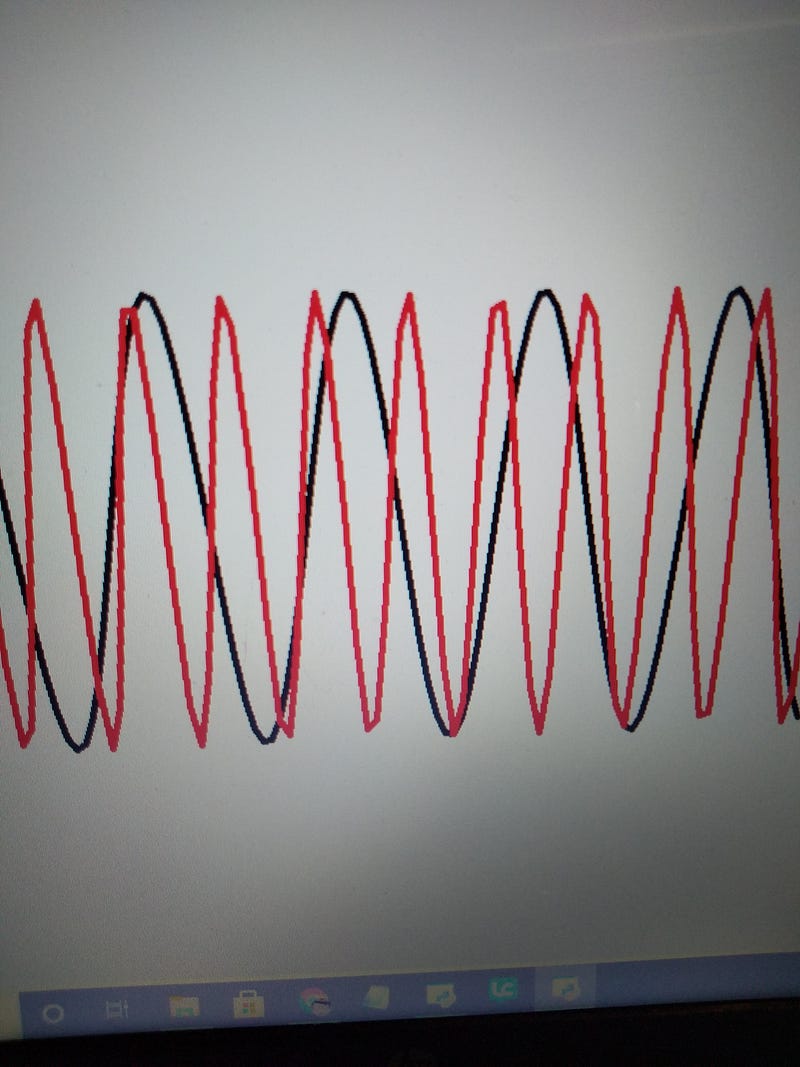
In a previous lesson we introduced the concept of graphing equations. In this lesson we are going to graph the equation of a sine wave.

Here’s the code:

import turtle as T
import math
T.width (5)
amplitude = 30
frequency = 6
frequency2 = 7
T.penup()
T.goto(-300,0)
T.pendown()
for i in range (-300,300,frequency):
    y = (math.sin(i))* (2*math.pi*amplitude)
    T.goto(i,y)
T.pencolor ("red")
T.penup()
T.goto (-300,0)
T.pendown()
for i in range (-300,300,frequency2):
    y = (math.sin(i))* (2*math.pi*amplitude)
    T.goto(i,y)
T.hideturtle()

The sine wave is an import concept in It in both pure and applied mathematics, as well as physics, engineering, signal processing and many other fields.We will be looking at this in more detail in subsequent lessons. For now experiment with changing the amplitude and the frequency.

Jim McAulay🍁 says “It takes a village to raise a child. It takes a distillery to homeschool one.”.

81–78

Technology
Illumination
Jim Mcaulay
Python
Python Turtle
Recommended from ReadMedium