
GoLang Services: Metrics Instrumentation for Kibana APM
In this article I will explain the importance of metrics, how context propagation works for this case, out of the box metrics and how you can build your own custom metrics to be exported to the Kibana APM.

Prerequisites
- Basic knowledge of GoLang is required as I will not be covering the basics. (Golang version 1.18)
- This will not cover the set up of Kibana nor Elastic Search clusters, only GoLang portion of it
- IDE of your choice, VSCode is my preference
Introduction
The more complex the services you build, the more information you will need from the inside to monitor and understand what it is going on in the run time. Engineering microservices is more than just building fast logic machines, but they have to be reliable and easy to spot bugs or decreased performance in production. One of the important areas to accomplish this, is Metrics.
Last year I had the chance to lead one of my team’s most important project that focused in incorporating different layers of monitoring, logging and metrics in our space. We contain different services, from real time ingestion to APIs that handle million of transactions and since I joined the team, our debugging was a game of guessing.
Kibana APM
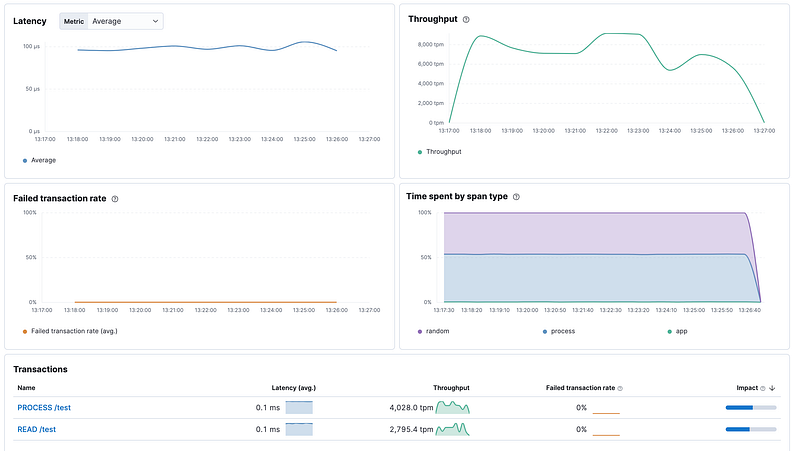
Kibana APM is one of the services that Elastic offers and it translates to “application performance monitoring”. With this you can visualize internal processes and the breakdown of them. This is how a dashboard of APM metrics look like:
Metric Breakdown
The fundamental of the metric consist of two concepts a transaction and a span. These two combined with the context propagation concept is what makes the APM metric powerful. If you want more information from kibana itself, here is the documentation.
A transaction is the main piece of information that the APM agent sends. It is the top-level operation, describing the main metric you would like to export. Main uses are HTTP, gRPC requests, data transformation process, cycles, etc. A span is secondary level operation, usually refer as children of the transaction. A common pattern is to have a parent transaction that describes the whole process to monitor, and its function calls or sections of code inside the process to be span. This is a pseudocode representation of a standard metric:
func MainOperation(ctx context, …) {
   startTransaction(ctx)
   ...
   // logic here
   ...
   ChildFunction1(ctx, ...)
   ...
   ChildFunction2(ctx, ...)
   ...
   closeTransaction()
}
func ChildFunction1(ctx, ...){
startSpan(ctx)
...
closeSpan()}
func ChildFunction2(ctx, ...){
startSpan(ctx)
...
closeSpan()}
The above representation shows the fundamental of the metric’s flow. We use a context to start our parent transaction (this context can be created here if it’s not passed as an argument). In this stage we can add information to the transaction as type and name. Here the recording of the metric starts, and we pass the context (that under the hood contains the transaction information) into our child functions to create the spans.
I have made this pseudocode so anybody (not just Golang) can implement the flow in their spaces. But now let’s code it as gophers:
With this pattern you can instrument your metrics however you like with little to no dependencies. Key concepts to know are the name and type of the transactions and spam as Elastic groups and aggregates them to further displaying them in the dashboard.
Out of the box APM packages such as mongoDB or gRPC support this flow perfectly, you only need to use the context propagation into their functions.
The APM agent (if configured right) will automatically capture these metrics, but there is one more thing you would need to implement for the APM agent to work correctly. The Kibana documentation doesn’t explicit specify it but, you need to include a http server with the APM wrap function.
This is a boilerplate router code snippet for go-chi that would do just enough for this case:
Examples
To visualize how the metric flow will be displayed in Kibana, I have set up a chain of processes that are trigger randomly. Worth noting, this is a generic example of how the logic of the metric works and not a particular real world code. For the full code, click here
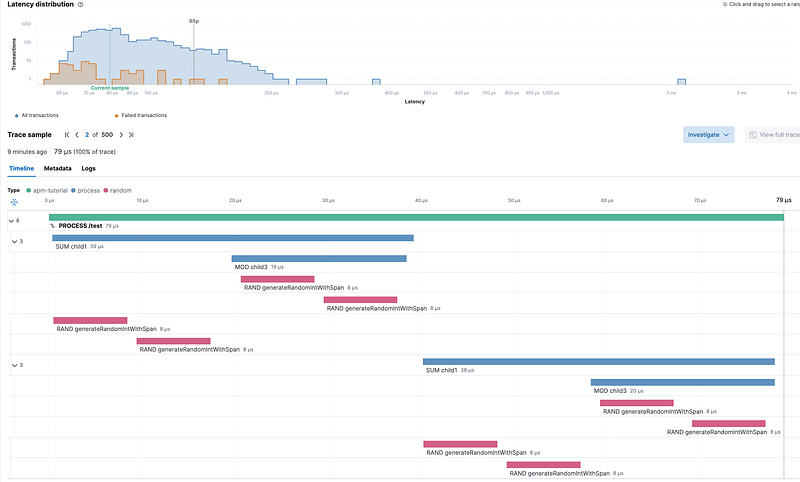
This is a process that it’s triggered thousand of times in random intervals. The purpose is to see how the transaction is break down into child spans, as deep as you have added them into your code.
Here is the visualization of the transaction sample. It gives you a detailed explanation of the time taken in each process, the hierarchy between them and extra information you could add.
I have added a different transaction and run them together to show you how the transaction panel looks like for the different type of transactions that are aggregated by name:
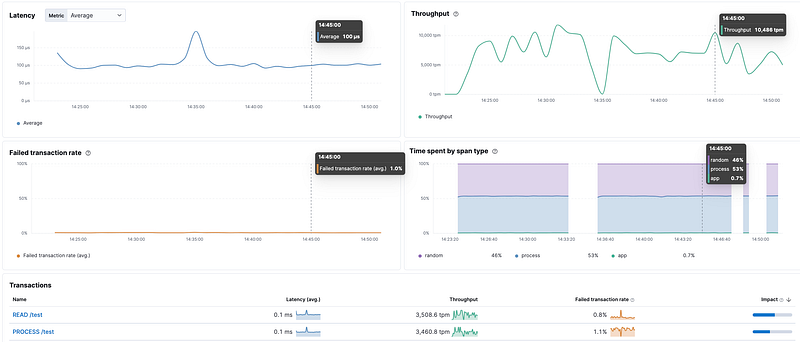
Metrics such as average latency, throughput in the interval, failing rate, etc.
My recommendation is to separate each transaction/spam into its own categories by configuring the type and names of each one. One of our use case is each transaction corresponds to a Kafka message which each message breaks down into spans that correlate to the business logic that goes through.
This system has helped my team enormously, as it gives us perfectly displayed data with information such as performance and error rates. In a production environment, the quicker you get this information, the faster you can analyze the availability of your services to your clients.
Any feedback is appreciate it, and follow for more articles like this.
Thank you for your reading :)