
GoLang Monitoring 101: A journey for the perfect system
Logging
Logging has become one of the most important aspects in modern coding, from helping you provide useful information in the runtime of your app to solving bugs easier, it is important to have a good practice while logging.
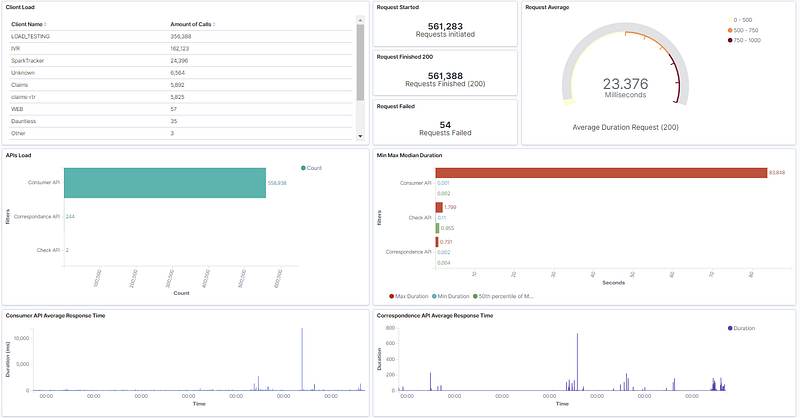
A few months ago, I took charge of refactoring our logging system in our go microservices (10+ different applications including APIs and backend services) and after a sprint of researching the best way to approach it, we had our hands dirty and we went from plain sentences in stdout to JSON structured logs that could be parsed in Elasticsearch and use it to build dashboards in Kibana. In this blog, I will guide you to the process and teach you how you can achieve that level of useful information (It will be focused on pure GoLang, Elastic and Kibana will be in a different post).
First steps: Review your source code
In our field most of the time, we do not have full control of the code as different developers contribute to the daily changes (unless you are the only maintainer) or even taking projects from an older team. This brings issues but nothing you can not handle. There are two things you have to notice when reviewing the source in this aspect, under-logging, and over-logging.
The most current problem is under-logging, usually, it is because developers forget to implement “extra” lines to provide extra information as we (sometimes I fall in the category) know what it does and we are fine with that when it is not the best to do (similar to commenting source code). Over-logging is easier because it is deleting lines of code that are not useful or they do not provide meaningful information. It can get tricky as we go because with over-logging, every line could seem meaningful but it may not add any value to our goal, which is to monitor our applications from the insight.
Both can be considered tech debt as they are not good practices. But we are here to fix them. There is a term called log level, we will touch it more in-depth in a bit but this is fundamental to prevent over-logging. The next tip is to review your goal, what information will be useful for you and your team. As an example, Handlers functions are one of the most important in the API world, a good practice is logging when the function is triggered, and when the function returns the response. This gives us a few insights:
- We can log the total duration of the API call, this helps us keep accountability of how fast the API is performance.
- Important information can be extracted from here too, such as the HTTP method, handler name, client’s name, and more.
This type of analysis has to be done for most of the code while keeping in mind what type of information you are looking for, the process will be easier as you get used to.
Using an instance of a logger
As you probably noticed, we are not using fmt.Printf that most people use to “log”. Different libraries such as logrus or zap use instances of a logger. This is really important because offers a lot of features and you can personalize it as you want. In this article, we will focus on logrus, as it is the package I have more experienced with and it has good performance.
In my research, I found different alternatives on how to use instances of a logger. I ended up with the two best approaches, a global logger and a “local” logger per package or function. When you want to have a custom logger for a package, the local option is the best. You can instantiate a logger and pass it through the functions like this example:
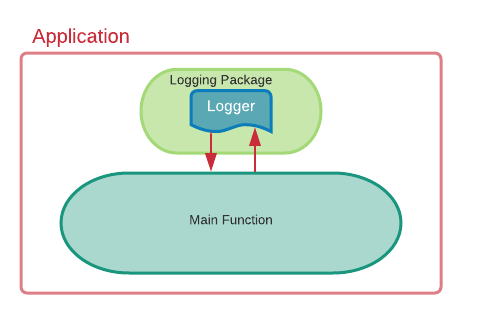
Even though it may not be the most pretty nor efficient way, it gives you the possibility to constumazie that logger multiple times. The second option is to create a logging package, use a global variable to hold the configuration, and use that in your service. Example:
In your main function, you use the logging.StartLogger() and you are good to go! In the NewLogger function, I use a simple configuration to output the logs into Stdout and to format it in JSON. This gives us the flexibility of calling the logger whenever we want without passing it to a function.
Standardized logging functions and JSON fields
This is probably the most important part of the blog, as it will differentiate a way of logging that is not usually implemented. Most of the time, logging comes to one-liners in this format:
logger.Infof(“Something happened”)Which it is easy, but not convenient nor dev friendly. The idea that will make the difference for you is in this situation is the following. In your API, there are different handlers, and more than one developer has upgraded the API along the way. At the end of each handler, we log the outcome of this handler. And you see two different statements in the console:
{ “level”:”info”, “msg”: “Process completed, data returned for client Y”}{ “level”:”info”, “msg”: “Handler completed, response sent back”}To clarify, none of them are exactly wrong but it is not my preference and there is a lot of room for improvement. Highlighting the issues, we start with the fact that it does not give us a lot of information. A simple message will not help us to figure out the state of the app nor help in case if something is not working correctly. Even though the logs are in JSON format, it is not taking the full advantage of it as there is no way we can look/query log messages with one line messages.
How can we improve it then? I have found a way that we get rid of different messages for the same purpose, and it is useful when teams need to collaborate together. Introducing the logging functions, that will act as abstraction/wrapper of the actual meaning of the log. For example, we want to have a log every time a handler is called. We create a function called HandlerStart in our logging package, then we implement the actual log call:
And this is how we call it in any part of our application:
log.HandlerStart(“Tutorial”, “Started”, “Handler”, time.Now())And the output gives us meaningful information on what is happening inside.
{“Handler”:”Example Handler”,”Status”:”Started”,”Time”:”2020–10–05T20:55:05.982493–05:00",”client”:”Tutorial”,”level”:”info”,”msg”:”Handler Example started”,”time”:”2020–10–05T20:55:05–05:00"}Some general places that may be useful could be before and after initializing Databases, Error statements according to the function, before and after important functions happen such as router initialization or batches creation. It has endless possibilities. I usually have a separate go file for each purpose and I join functions that have the same idea in them. Such as all connection related functions, goes under connection.go
The idea of the fielded logs is to make queries easier and to aggregate data faster when you are using ELK stack or any other logging/metric system. Important fields like id, or traces have to be inside the logs for debugging, the name of a specific process is also helpful to know where is the log coming from.
Extra advice
Another field that I find useful especially under microservices, it’s the service name or the application name. When you want to repeat a field in your logs without the need for repetition, hooks are your best options but it takes a bit more of a setup.
For this, we have to create a struct with that satisfies the interface of the Hook in logrus (it needs two functions). In our file where we set up the logger, let's add this:
In the Fire function is when we add the permanent field for our logs, which is the service name.
Now in our StartLogger function, we add the AddHook function like this:
And that’s it!
Hopefully, by the end of the blog, you have a better sense of the way that logs can be improved. It has been super useful for my team since we migrate to this new “framework”. I will include a new blog to set up the ELK stack and give our logs even more meaning. Any feedback is appreciated! Thank you


