
WEEKLY BUSINESS ROUNDUP
Global Business Week: The World’s Biggest Stock Markets, by Country
The state of Financial markets & Economies, Weekly Charts, Business Trends & Statistics
Last Friday, the S&P 500 experienced a decline, marking its second consecutive weekly drop. Tech stocks bore the brunt of the downturn amidst ongoing concerns about inflation ahead of the Federal Reserve’s upcoming policy meeting next week. Investor apprehensions heightened following the release of data indicating inflation surpassing economists’ forecasts.
Despite the latest consumer inflation report, Wall Street remained unfazed, with market expectations for interest rate cuts largely unchanged. The Consumer Price Index for February increased by 0.4% month-on-month, in line with expectations, and slightly accelerated compared to January’s 0.3% rise. Meanwhile, the Core CPI, which excludes food and energy, saw a 0.4% month-on-month increase, slightly surpassing the anticipated figure of +0.3%.
Consequently, the benchmark 10-year Treasury yield (US10Y) surged by 21 points over the week, prompting speculation about whether inflationary pressures have subsided sufficiently for the Fed to consider interest rate cuts in June. For the week, the S&P (SP500) registered a modest decline of -0.1%, the Dow Jones saw a marginal decrease of less than -0.1%, while the tech-oriented Nasdaq experienced a more pronounced drop of -0.7%.
The dollar index secures gains for the week following higher-than-anticipated US CPI and PPI data. Traders are now eyeing a potential initial rate cut from the Fed in September. The US Dollar Index is hovering around a critical level, potentially breaching 104.00. Technical indicators on the daily chart highlight a prevailing selling trend in DXY. While the Relative Strength Index (RSI) shows a positive slope, it remains in negative territory, indicating continued control by bears, albeit with buyers gaining momentum.
Conversely, the Moving Average Convergence Divergence (MACD) histograms display diminishing red bars, signaling reduced selling pressure. Despite gradual bullish advancements, strong downward pressure persists. A shift towards a bullish stance awaits RSI entering positive territory and MACD bars transitioning to green. Until then, the bearish outlook prevails.
This weekend stands in stark contrast to the previous ones, marked by heightened volatility as the leading cryptocurrency sharply declined to a ten-day low of under $65,000. Alternative coins have also dipped significantly, contributing to a total crypto market cap loss of over $100 billion in a single day and more than $300 billion over the past few days. Monday started positively, with BTC rebounding from $67,000 after a Sunday evening retracement to surpass $70,000 and establish a new all-time high. The asset continued its ascent in the following days, peaking at $73,800, its current ATH.
However, this peak on Thursday was swiftly followed by a substantial rejection. Bears seized control of the market, driving Bitcoin’s value below $66,000 on Friday. BTC managed to regain some ground on Saturday and briefly tested $70,000 but faced significant resistance, resulting in a retreat back to $68,000. Altcoins mirrored BTC’s downward trajectory, experiencing substantial declines. Ethereum, which had been gaining momentum until Friday’s rejection, surpassed $4,000 but has since dropped below $3,500 after a 7% daily decline.
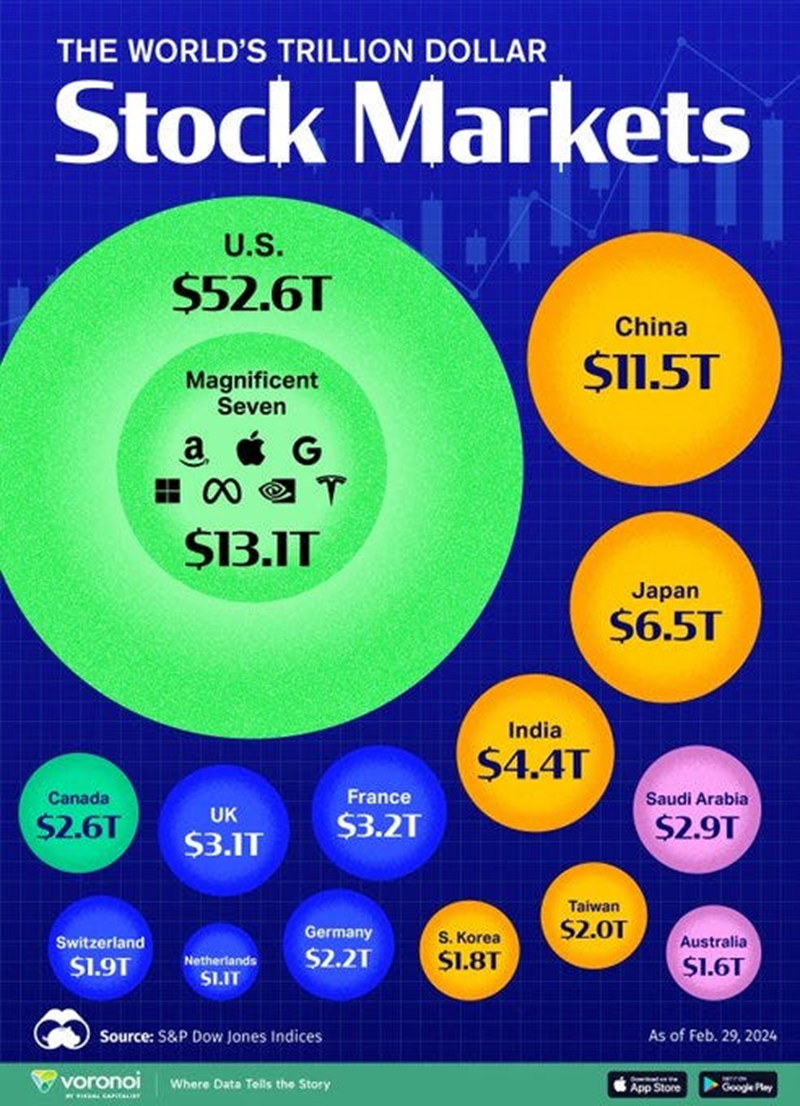
Today’s featured infographic depicted the global market capitalization of stock markets by country, utilizing data sourced from S&P Dow Jones Indices. Specifically, this visualization is based on the methodology of the S&P Global Broad Market Index (BMI), which encompasses over 14,000 stocks from both developed and emerging markets. For additional context, it also represents the size of the “Magnificent Seven” stocks within the total market capitalization of the United States.
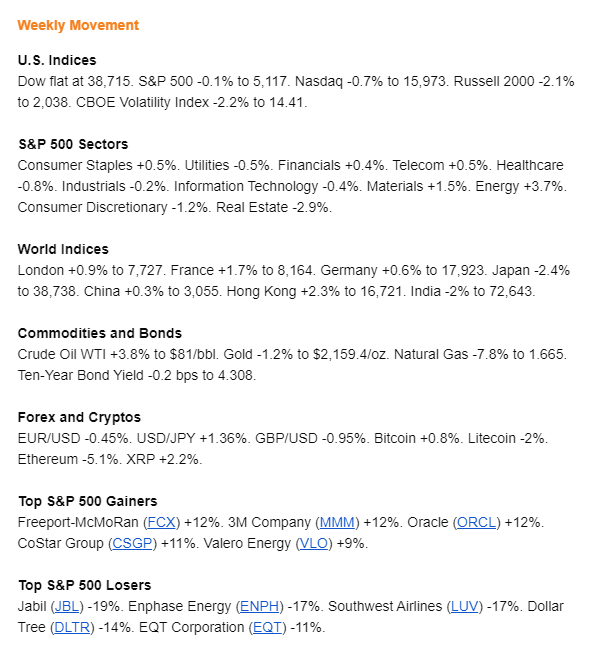
And finally, before moving on to other statistics, here are the weekly & YTD numbers from various markets and assets (Figure 1).
Digital Asset Spot Volumes
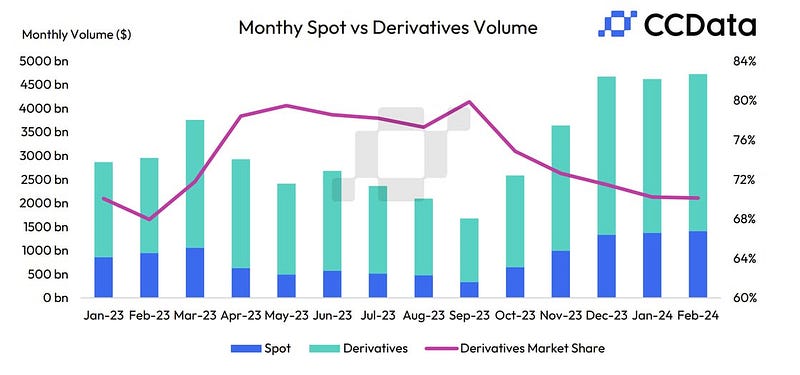
Digital asset spot volumes saw an increase for the fifth consecutive month in February (Figure 2). Trading activity continued to surge as traders speculated on the price movements of digital assets, especially as Bitcoin neared new all-time highs. The combined volume of spot and derivatives trading on centralized exchanges experienced a 2.28% rise, reaching $4.73 trillion. Volumes remained significantly inflated compared to the previous year.
Richest Countries
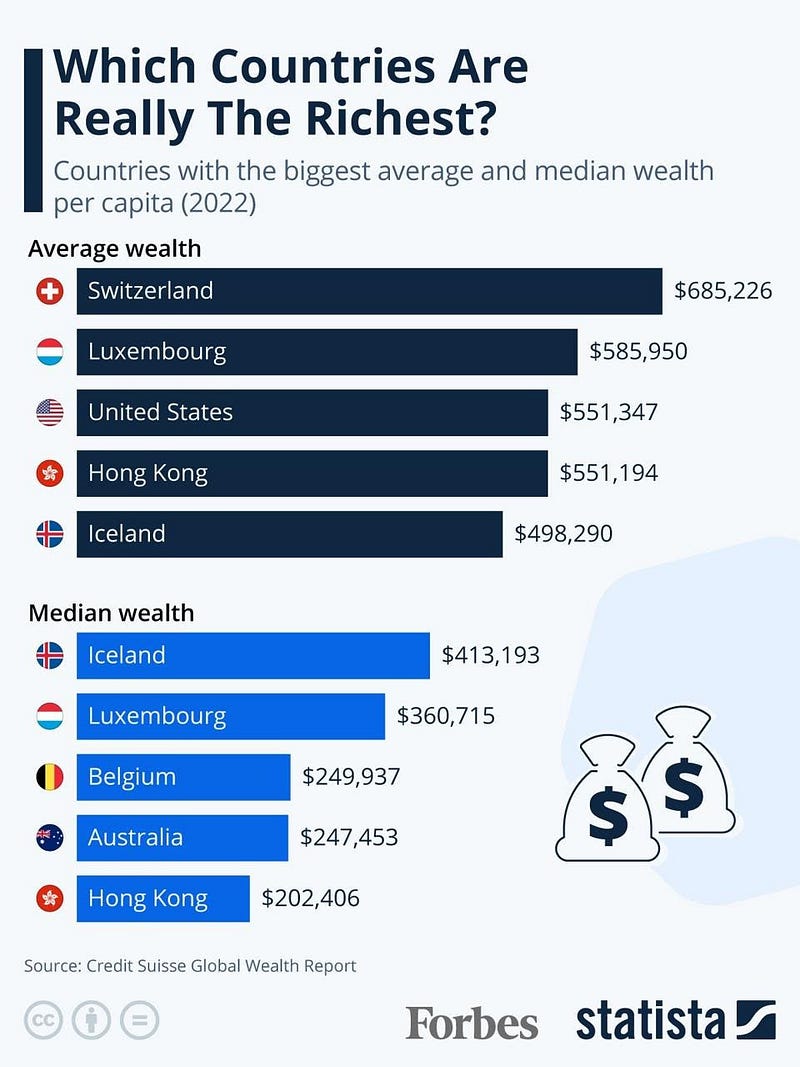
When ranking countries based on the size of their economies or their overall gross wealth, the U.S. typically holds the top position, followed by countries such as China, Japan, or Germany (Figure 3). However, when sorting nations by their per-capita average wealth or median per-capita wealth, other countries emerge as leaders.
According to the first metric, Switzerland stands as the richest country in the world with an average per-capita wealth of approximately $685,000, followed by Luxembourg and the United States. In terms of median per-capita wealth, which represents the wealth of the individual who shares their country with an equal number of richer and poorer individuals, Iceland leads the ranking with around $413,000 in wealth held by this hypothetical person.
Climate Tech Funding
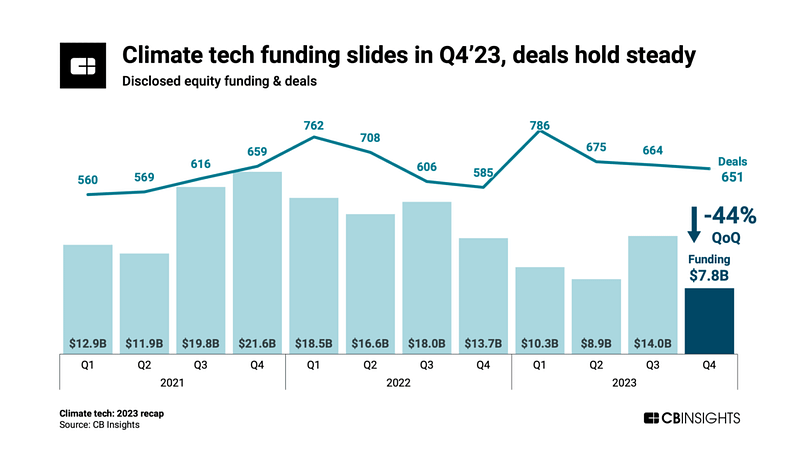
Despite deal counts remaining stable, funding to climate tech companies experienced a downward trend in Q4'23 (Figure 4). However, with deal sizes decreasing, there has been a corresponding move towards early-stage dealmaking. In 2023, 69% of climate tech deals were allocated to early-stage companies, marking a 14-percentage point increase compared to 2022. Utilizing CB Insights data, we delve into the climate tech landscape, examining the markets and startups garnering the most traction.
Crypto Venture Funding
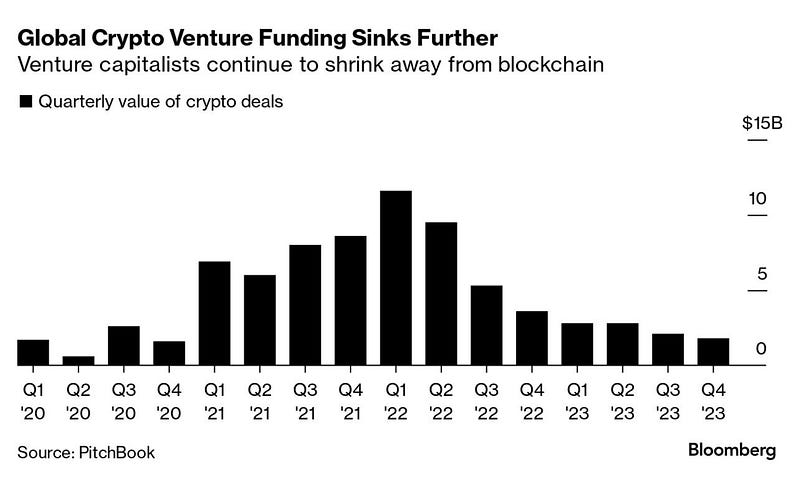
Meanwhile, the venture capital enthusiasm that fueled MoonPay’s previous round is currently absent. Data from PitchBook indicates that funding for crypto-related companies in the fourth quarter of 2023 amounted to just $1.9 billion, marking the lowest value since the same period in 2020 (Figure 5). Until investment flows back into the market in earnest, beyond mere exposure to Bitcoin, it’s challenging to assert that the crypto sector has fully recovered. Nevertheless, it’s unlikely to find a digital asset trader disregarding today’s prices.
Gender Pay Gap
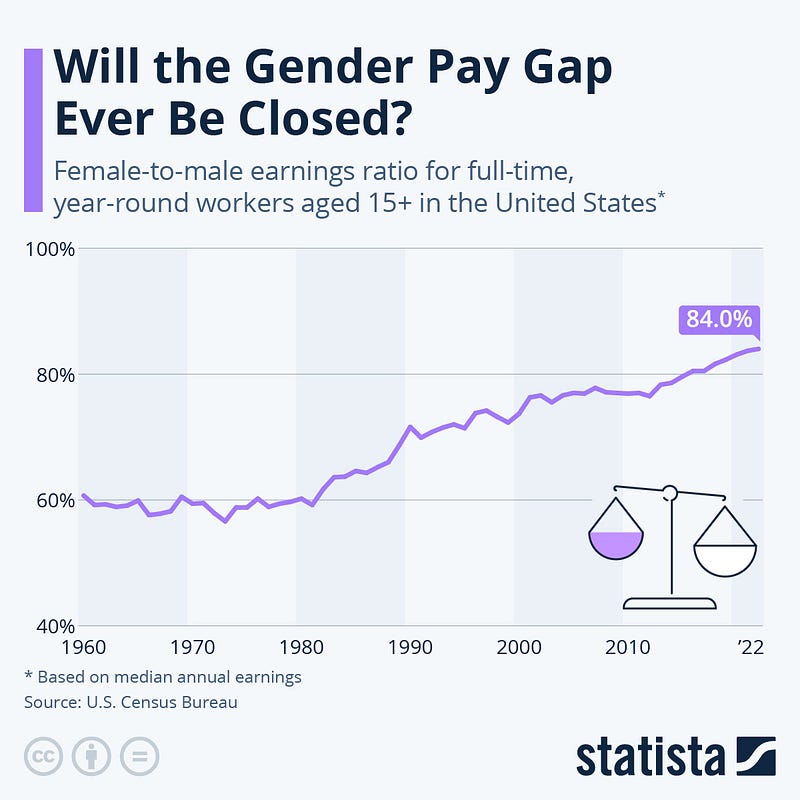
Data from the U.S. Census Bureau’s Current Population Survey reveals that in 2022, the median annual pay for female full-time, year-round workers aged 15 and older stood at $52,360, whereas male workers earned $62,350 (Figure 6). This translates to women earning just $0.84 for every dollar earned by men, requiring them to work approximately 19% longer (roughly 10 weeks) to achieve parity.
As depicted in the chart, progress has been evident over the past six decades, with the female-to-male pay ratio gradually improving from less than 60% in the 1960s to over 80% in recent years. However, progress has been slow, and achieving full pay equality remains a distant goal. Furthermore, the gender pay gap varies among women, being notably wider for Black, Hispanic, and Native American women, as well as for working mothers.
Global EV Sales
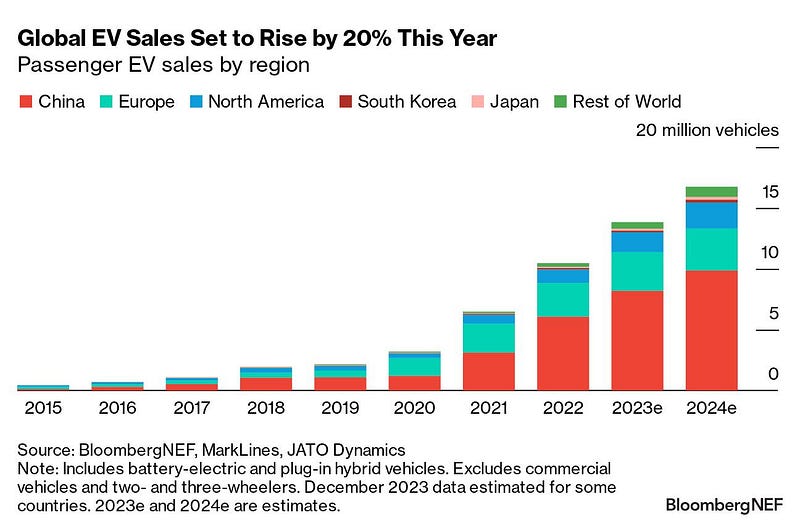
The excitement surrounding electric vehicles (EVs) continues to soar, with BloombergNEF projecting sales of 16.7 million plug-in cars for this year, marking a 20% increase from 2023 (Figure 7). However, these estimates predominantly favor Asia, with nearly 60% of global EV sales projected to occur in China in 2024. Conversely, in other regions such as the US and Europe, a blend of diminished incentives and financially constrained buyers is anticipated to lead to sluggish sales growth.
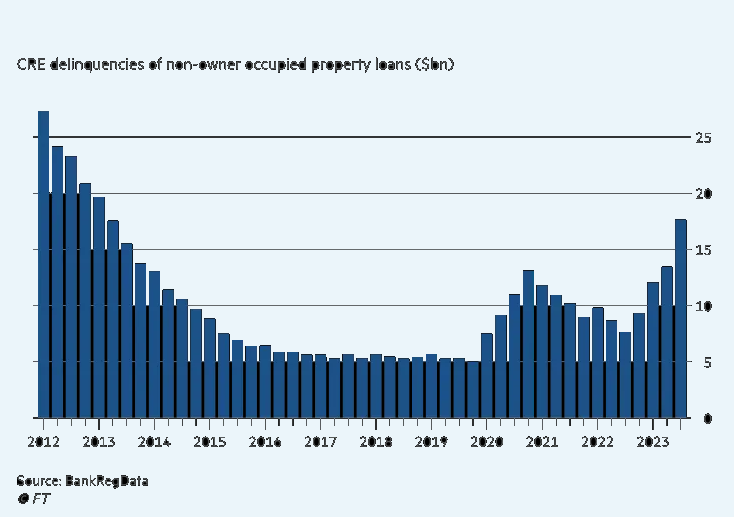
CRE Delinquencies
U.S. banks’ exposure to commercial real estate (CRE) loans remains a significant focus (Figure 8). It will be crucial to effectively manage these loans by conducting thorough financial evaluations of borrowers, staying informed about market trends, and implementing proactive risk reduction measures. Moreover, regulatory bodies and policymakers are expected to closely monitor this sector, potentially introducing new guidelines or regulations to protect its stability. The ability of banks to adjust to market shifts, adeptly handle risks, and introduce innovative lending strategies will be crucial in maintaining their resilience and the overall health of the financial system.
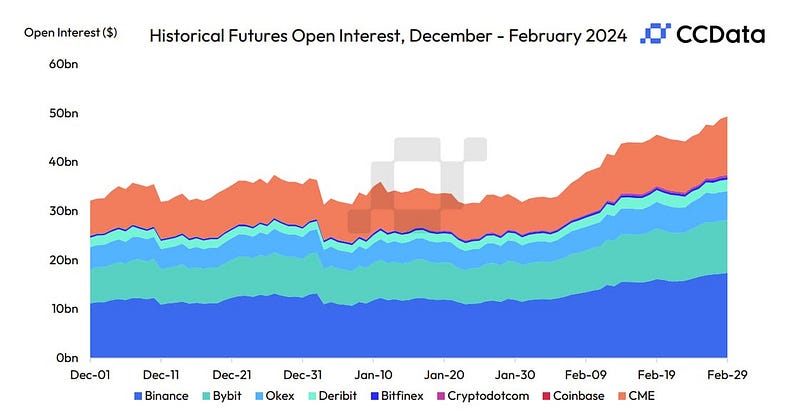
Crypto Futures Open Interest
In February, the open interest on derivatives exchanges continued to surge to record levels as traders amplified their positions while Bitcoin approached a new all-time high, skyrocketing by 54.9% to $49.3 billion. The three largest derivatives exchanges, namely Binance, OKX, and Bybit, witnessed a notable increase in open interest, rising by 51.1%, 47.5%, and 42.9% to $17.4B, $5.90B, and $10.7 B respectively (Figure 9).
During the same period, funding rates across the analyzed exchanges saw significant growth compared to January, reflecting the prevailing positive market sentiment as Bitcoin neared its all-time high. The funding rate remained consistently positive throughout the month, steadily increasing and underscoring the leverage present in the market. Analyzing the average funding rate, traders on OKX and Binance displayed a more bullish stance, with exchanges averaging a funding rate of 6.80% and 5.94% respectively.
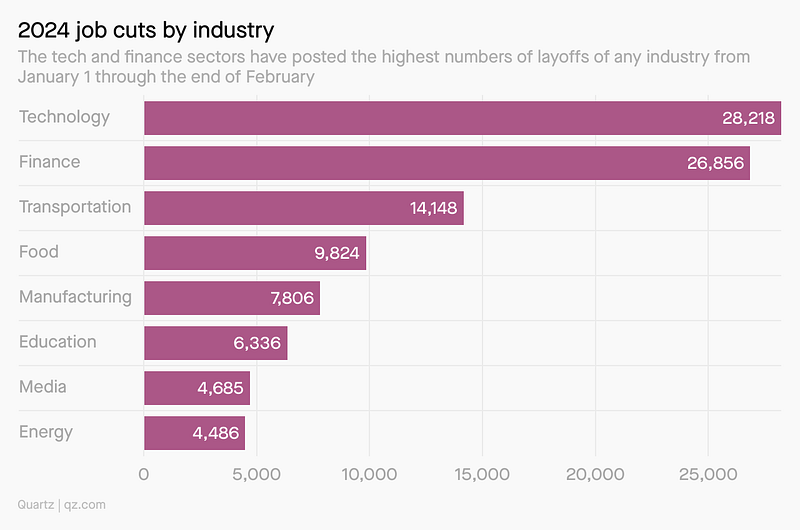
U.S Job Cuts 2024
In February, job cuts at U.S. companies surged to their highest level since 2009, as reported in the monthly layoffs report from Challenger, Gray & Christmas, with the tech sector playing a significant role in this trend. This pattern extends beyond U.S. borders. A comparison between Challenger’s report on U.S. employers and the global tracker Layoffs.fyi revealed that U.S. employers contributed to over half of the tech job cuts recorded worldwide in 2024 (Figure 10). While this may seem concerning, it’s noteworthy that job cuts in the tech industry are considerably lower than they were last year. Despite AI’s involvement, primarily in restructuring teams rather than automating roles, the impact on job cuts is less pronounced.
Market Comic: US Inflation figures remain stubbornly high

Previous Edition of GBW:
Originally published at https://khanfk.substack.com.


