
WEEKLY BUSINESS ROUNDUP
Global Business Week: The fantastic journey of S&P 500 in 2020
The state of Financial markets & Economies, Weekly Charts, Business Trends & Statistics
Traders in the U.S will have a lot to reflect on this long weekend. After a choppy week that saw the Nasdaq and S&P 500 post their worst weekly returns since the end of October, investors will face a shortened, but busy week ahead. This past week, earnings season kicked off with the initial releases showing big banks posting disappointing revenues. Also in focus was the weak retail sales data in December and a spike in weekly jobless claims. The unveiling of the $1.9 trillion stimulus plan by the incoming U.S administration offered a ray of hope.
Despite this, the U.S. equities struggled to make new highs this week. In fact, they posted the worst week since October — major benchmarks notched weekly declines, with the Dow off 0.9%, and the S&P 500 and Nasdaq both down 1.5%. However, the data however showed the money is not leaving the stock market. According to EPFR Global, $26.8 billion went into equities, while $9.3 billion came out of cash.
Actually, the mega-cap tech stocks that drive the cap-weighted indexes higher all fell this week as investors continued to rotate into cyclical stocks and sectors. FAANG plus Tesla were the culprits — which together, make up more than 20% of the S&P 500 in terms of market capitalization. The broader market goes where they go.
There was a much-needed relief for the Greenback bulls as the dollar-weighted index closed at the highest level in more than three weeks. The basket index closed at 90.78, just below the immediate resistance @ 91.25. General risk-off sentiment in Equities also helped the reserve currency. With the U.S providing a stimulus of close to $5 trillion so far with the vaccination ramping up in the coming days, the largest economy might be better placed than some of the other advanced economies for a recovery. This might provide a boost to the Greenback.
It’s been a volatile week for Bitcoin and the associated Cryptos. The top digital coin has swung some 25 percentage points after charting an all-time high of $42k earlier. After falling close to $30k, it saw some strong demand at the dips and jumped right back to $40k in no time. At the time of writing, BTC is trading in the vicinity of $36k, with consolidation taking place below the recent high. The tug of war between institutional traders and short-term profit-takers is causing some massive price swings.
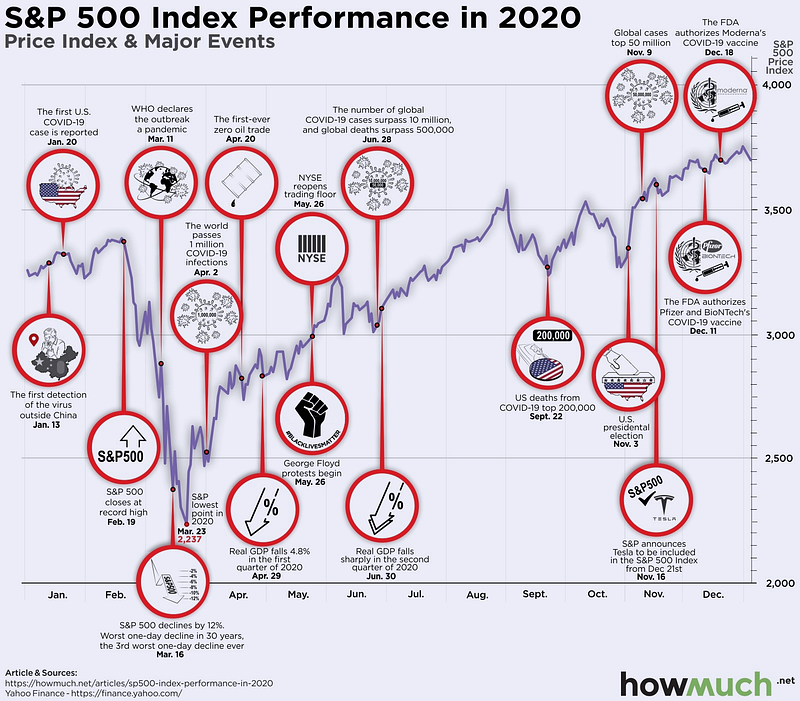
Today’s featured infographic (above) was created by Visual Capitalist by collecting daily S&P 500 performance data from Yahoo Finance. The most important news events of the year were then plotted on the chart to see how the index responded to these events. The S&P 500 index provided a V-shaped performance throughout 2020, which also saw the index set a record for the fastest bear market — with April 2020 being one of the best months in 80 years of stock market history.
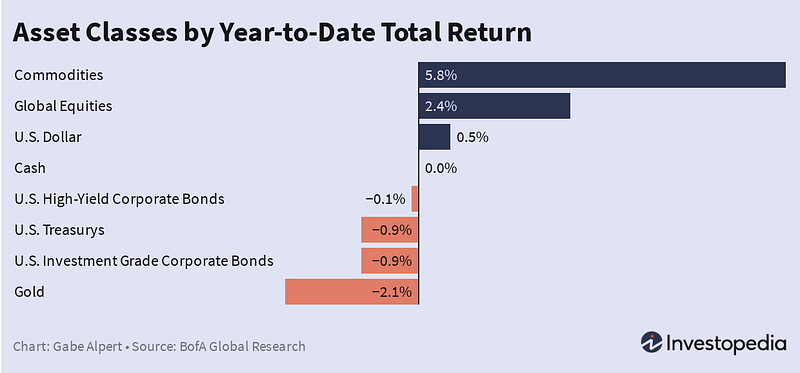
Before we move on to some of the other interesting statistics for the week, let’s look at the YTD asset returns (Figure 1).
Crypto Derivatives hit an All-Time high
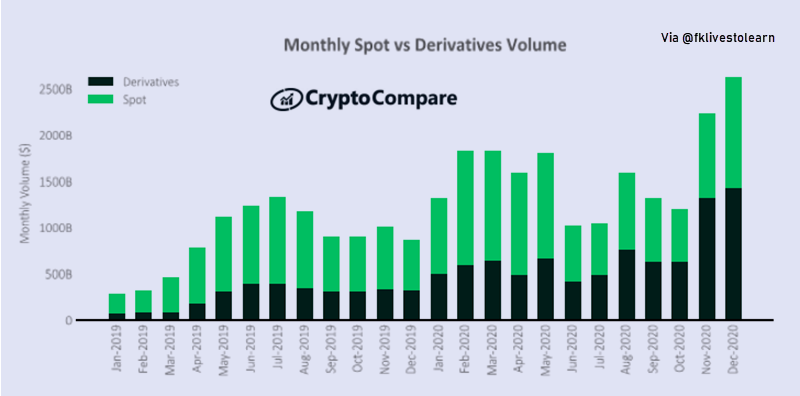
Crypto derivatives volumes increased 8.6% in December to an all-time monthly high of $1.43 trillion. Meanwhile, total spot volumes increased by 30% to $1.19 trillion (Figure 2). The derivatives market now represents almost 54.6% of the total crypto market (vs 60% in November). The massive volume increase points to a ballooning interest by traders in the digital asset class.
Commodity Returns in the Last Decade
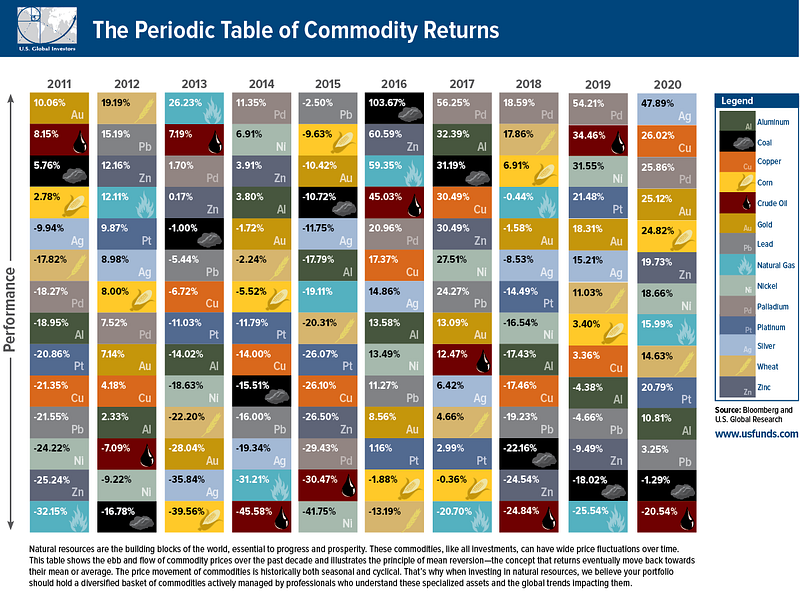
The infographic below (Figure 3) from U.S. Global Investors traces 10 years of commodity price performance, highlighting 14 different commodities and their annual ranking over the years. Commodities are typically known for heightened volatility and this can be seen in the price movement of Silver — it faced double-digit declines in the first half of the decade, falling over 35% in just 2013 alone. By contrast, it jumped over 47% in 2020. Similarly, oil, corn, and others witnessed either steep declines or rapid gains.
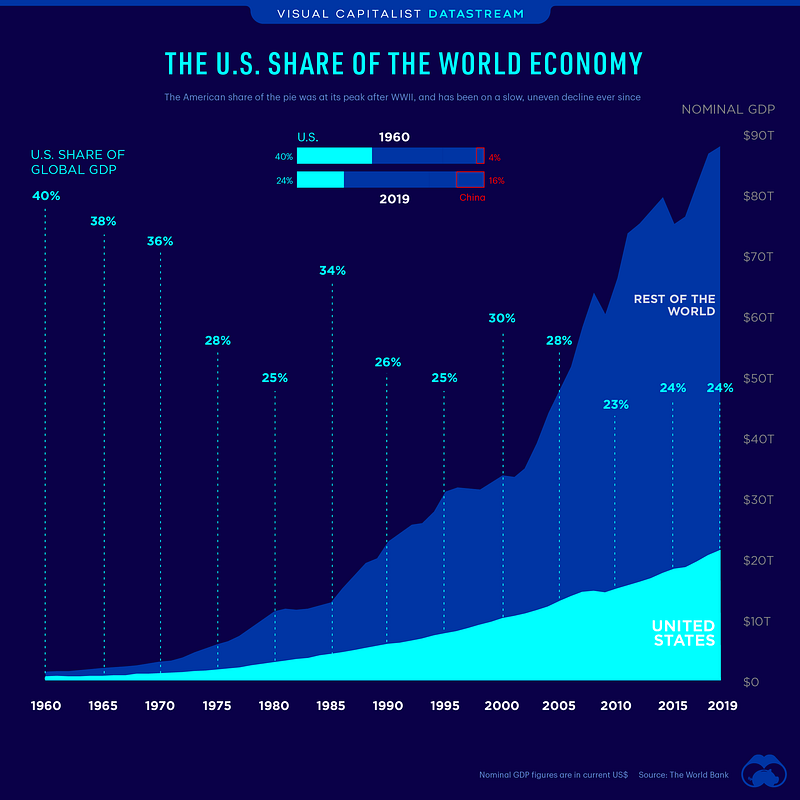
The U.S. Share of the Global Economy Over Time
The World’s largest economy (U.S) extends tremendous influence on the overall global economy. As of 2019, the U.S. made up almost a quarter of the global economy. Overall, the American dominance of the global output has declined over the past 60 years (Figure 4). While the U.S. economy has grown quickly over time, the global economy has grown even quicker. Since peaking at 40% in 1960, the U.S. share of the world economy has dropped to 24% — despite a rising national GDP and being the birthplace of some of the biggest companies on the planet.
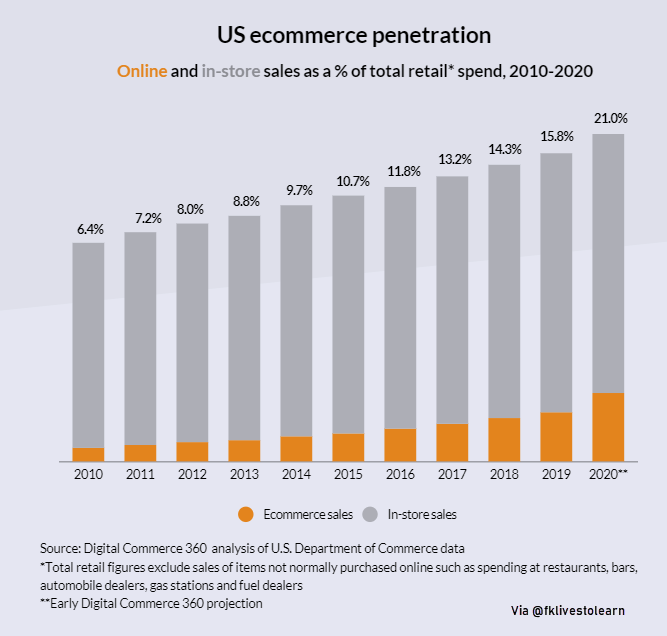
Booming E-commerce business 2010–2020
In 2007, e-commerce accounted for 5.1% of total retail purchases in the U.S. In 2019, as this infographic shows, e-commerce penetration neared 16.0%. Early Digital Commerce 360 estimates show online sales were a staggering 21.0% of total retail sales in 2020 (Figure 5). The big jump from 2019 to 2020 is attributed to the onset of the pandemic when people preferred to shop online than go visit a store physically.
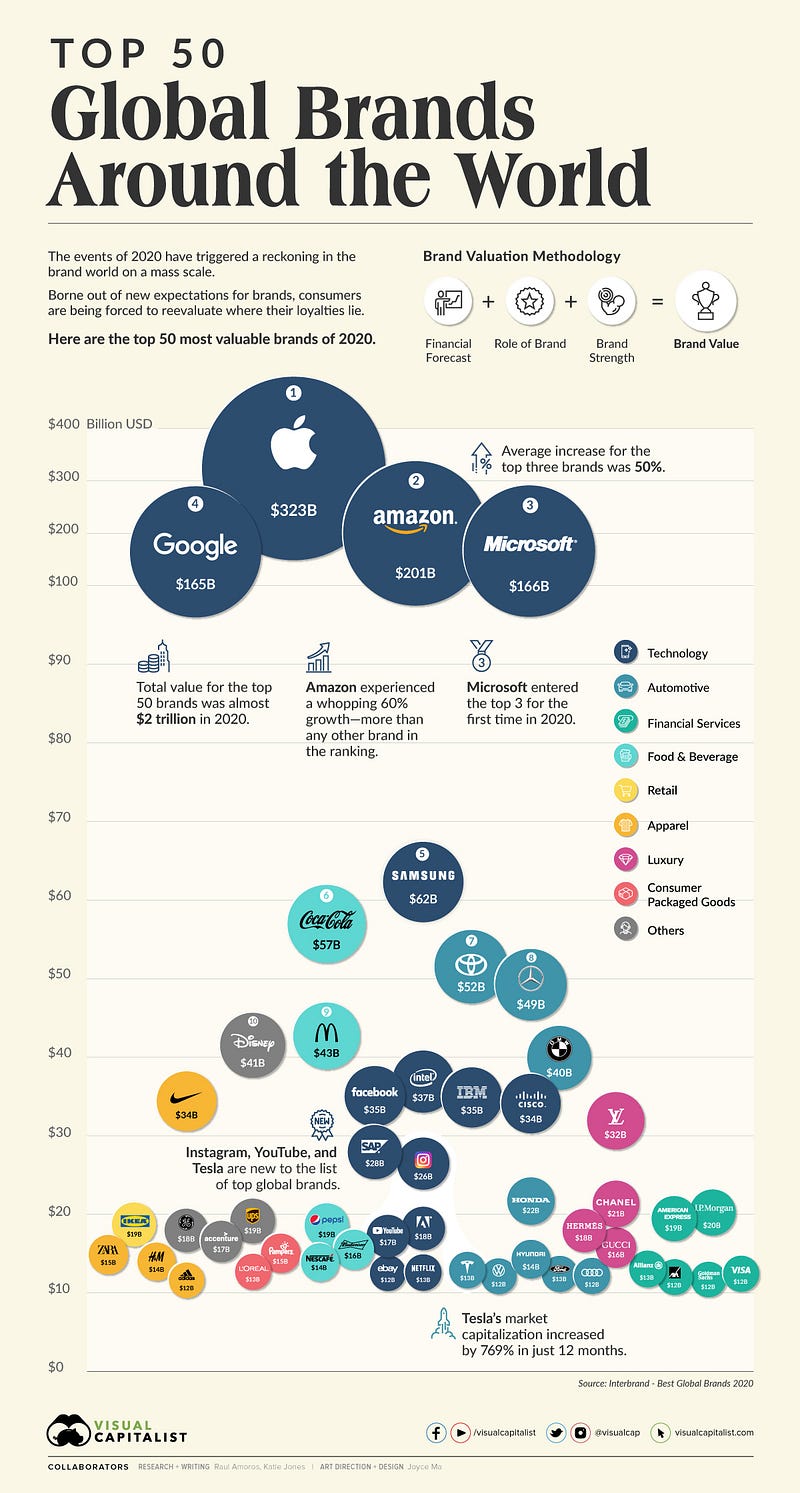
Visualizing the Top 50 Most Valuable Global Brands
The pandemic year has seen over half of the most valuable global brands experience a decline in brand value — a measure that takes financial projections, brand roles in purchase decisions, and strengths against competitors into consideration. But where some have faltered, others have asserted their dominance and stepped up for their customers like never before. The visualization below (Figure 6) showcases the top 50 most valuable global brands from a study conducted by Interbrand, which calculates brand value across hundreds of companies.
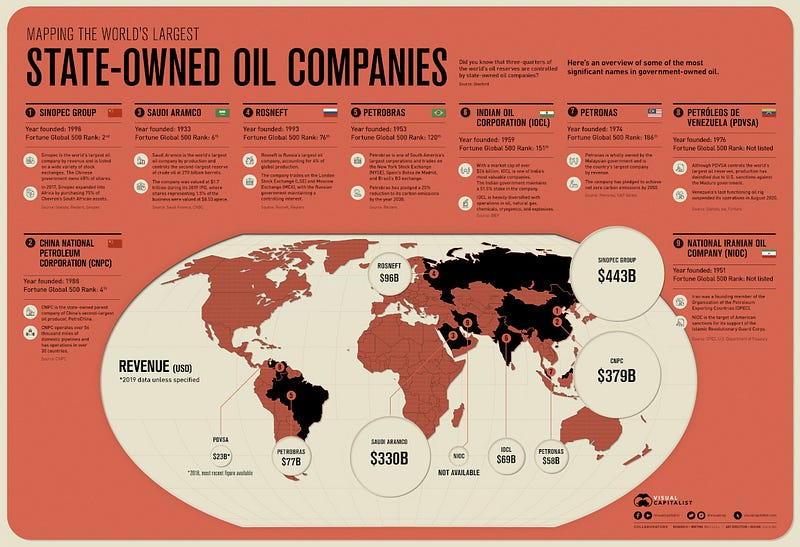
The World’s Largest State-Owned Oil Companies
Oil is one of the world’s most important natural resources and it has played a critical role in the development of the post-industrial global economy. Many governments choose to nationalize their supply of oil. This gives them a greater degree of control over their oil reserves as well as access to additional revenue streams. In practice, nationalization often involves the creation of a national oil company to oversee the country’s energy operations. National oil companies (Figure 7) are a major force in the global energy sector, controlling approximately three-quarters of the Earth’s oil reserves.
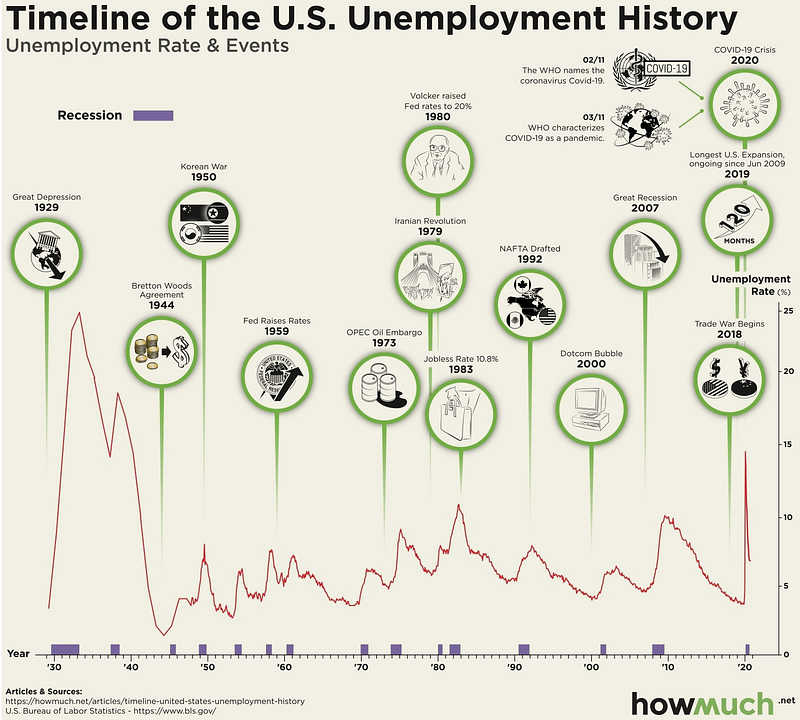
U.S. Unemployment Rates Since 1930
COVID-19 swept the U.S in mid-March and saw more than 47 million Americans filing for unemployment as the country entered a recession. How do today’s numbers compare to other major periods of unemployment? The infographic below highlights the trend, whose data was collected from the Bureau of Labor Statistics. The highest unemployment rate was 24.9% in 1933 (Great Depression), while the lowest unemployment rate was 1.2% in 1944 (Figure 8).
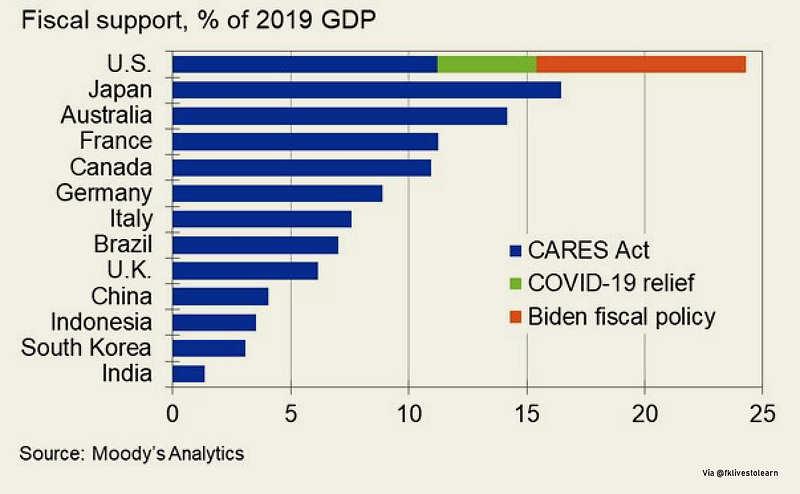
COVID-19 Relief by Various Countries
With the unveiling of the latest COVID-19 relief package by the incoming U.S administration, the U.S has become the highest stimulus providing country in the World (Figure 9). The chart below provides a clear picture of how U.S stimulus so far compares with the fiscal support provided by its contemporaries. At current levels, the U.S provided stimulus equivalent to a staggering 25% of its 2019 GDP. Japan was well over 15%, while Australia, France & Canada all provided a stimulus in double digits of their GDP.
Previous Edition of GBW
