
Getting Started With Streamlit: 5 Functions You Need To Know When Starting Out
Streamline your Streamlit learning with these 5 functions

Streamlit is a Python-based open-source framework that allows you to easily create and deploy interactive data science dashboards and machine learning models.
The library and company were formed in 2018 by a team of former Google engineers who recognised the challenges that data scientists and machine learning professionals face when developing and deploying interactive dashboards and models. In response, they created Streamlit as a solution to streamline the process and make it more accessible to a wider range of users.
Streamlit is built on top of Python and it supports many of the mainstream Python libraries that are commonly used in data science and machine learning, such as matplotlib, plotly and pandas.
To fully explore Streamlit’s capabilities, be sure to check out their comprehensive documentation at the link below.
Within this article, we are going to look at 5 functions that are essential to get started with Streamlit. Use the following Table of Contents to jump to the section that interests you.
· The Most Versatile Streamlit Function: st.write() · Add Columns to Your Streamlit App with st.columns() ∘ Controlling the Width of Streamlit Columns · Organise Your App with st.siderbar() · Upload Files with st.file_uploader() ∘ Uploading Multiple Files with st.file_uploader() ∘ Restricting File Formations with st.file_uploader() · Displaying Key Metrics with st.metric()
Installing Streamlit
Before we can run Streamlit apps, we first need to install the library. This can simply be done using the following command if you are using PIP.
pip install streamlit
Once Streamlit has been installed we can create a new file called app.py and start adding our code to it.
To run the code we need to enter the following in the terminal:
streamlit run app.py
This will launch Streamlit in your default browser.
The Most Versatile Streamlit Function: st.write()
This is one of the most versatile functions available within Streamlit and is also one of the first that you come across when starting out.
This function is described as the “Swiss Army Knife of Streamlit Commands” within the help documentation. When you start using it, you will see how versatile it is.
With st.write() we can pass in:
- text
- markdown
- LaTex
- pandas dataframes
- multiple arguments with text and variables
- chart objects
- emojis
- calculations
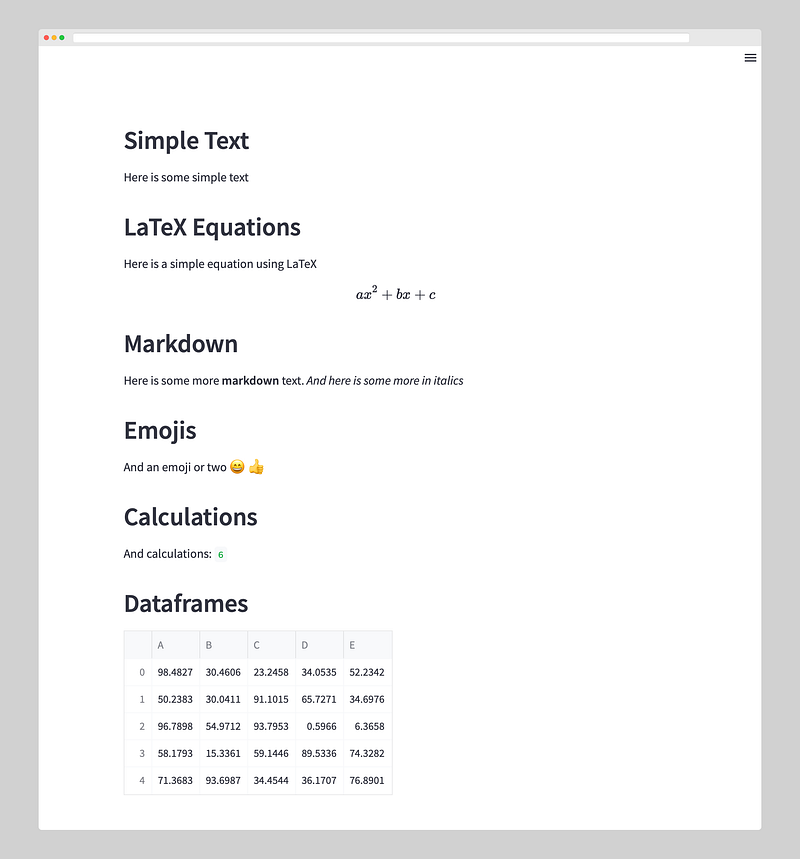
The code below illustrates these different applications for the st.write() function.
import streamlit as st
import pandas as pd
import numpy as np

# Simple Text
st.header('Simple Text')
st.write('Here is some simple text')

# Latex
st.header('LaTeX Equations')
st.write("""Here is a simple equation using LaTeX
$$
ax^2 + bx + c
$$
""")

# Markdown
st.write('## Markdown')
st.write('Here is some more **markdown** text. *And here is some more in italics*')

# Emojis
st.header('Emojis')
st.write('And an emoji or two :smile: :thumbsup:')

# Calculations
st.header('Calculations')
a = 3
b = 3
st.write('And calculations:', a + b )

# Dataframes
st.header('Dataframes')
arr_data = np.random.default_rng().uniform(0, 100, size=(5,5))
df = pd.DataFrame(arr_data, columns=list('ABCDE'))

st.write(df)
When we run the above code we get the following page.
Add Columns to Your Streamlit App with st.columns()
When starting out with your Streamlit app, any content you display is contained within a single column. This may be fine for some simple applications, but what if you want to create a slightly more complex layout?
That is where the st.columns() function comes into play.
As Streamlit does not have a native way to create a grid, we can use this function to start adding columns to our application.
# Creating a dataframe with random values in 5 columns
arr_data = np.random.default_rng().uniform(0, 100, size=(5,5))
df = pd.DataFrame(arr_data, columns=list('ABCDE'))
# Creating a simple figure
fig, ax = plt.subplots(1,1)
ax.scatter(x=df['A'], y=df['B'])
col1, col2 = st.columns(2)
with col1:
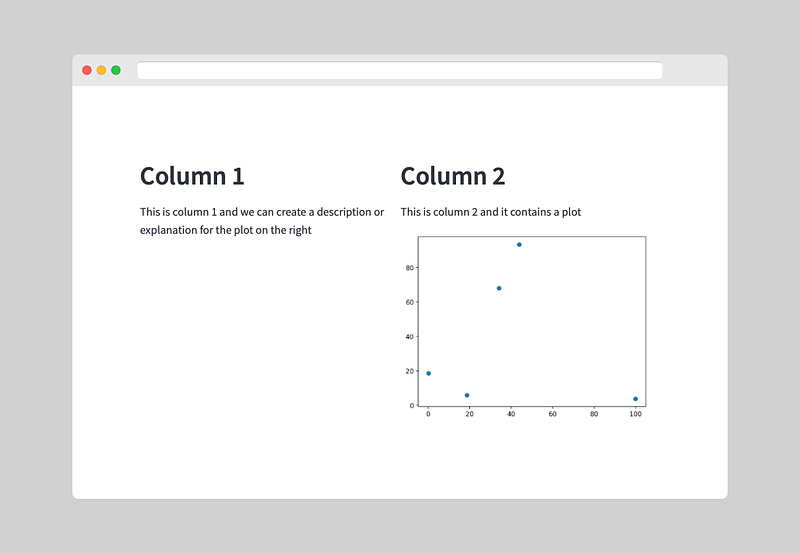
st.write('## Column 1')
st.write("""This is column 1 and we can create a description or
explanation for the plot on the right""")
with col2:
st.write('## Column 2')
st.write('This is column 2 and it contains a plot')
st.pyplot(fig)When we run our app, we now see two columns:
Alternatively, we could remove the with statement and add methods directly onto the column objects like so:
col1.write('## Column 1')
col1.write("""This is column 1 and we can create a description or
    explanation for the plot on the right""")

col2.write('## Column 2')
col2.write('This is column 2 and it contains a plot')
col2.pyplot(fig)
Controlling the Width of Streamlit Columns
If we want to control the width of these columns, we can pass a list to the st.columns() function. In this example, I have used [1,3] which means that Streamlit will generate 2 columns. The second column will be 3 times as wide as the first column.
col1, col2 = st.columns([1,3])

with col1:
    st.write('## Column 1')
    st.write("""This is column 1 and we can create a description or
    explanation for the plot on the right""")


with col2:
    st.write('## Column 2')
    st.write('This is column 2 and it contains a plot')
    st.pyplot(fig)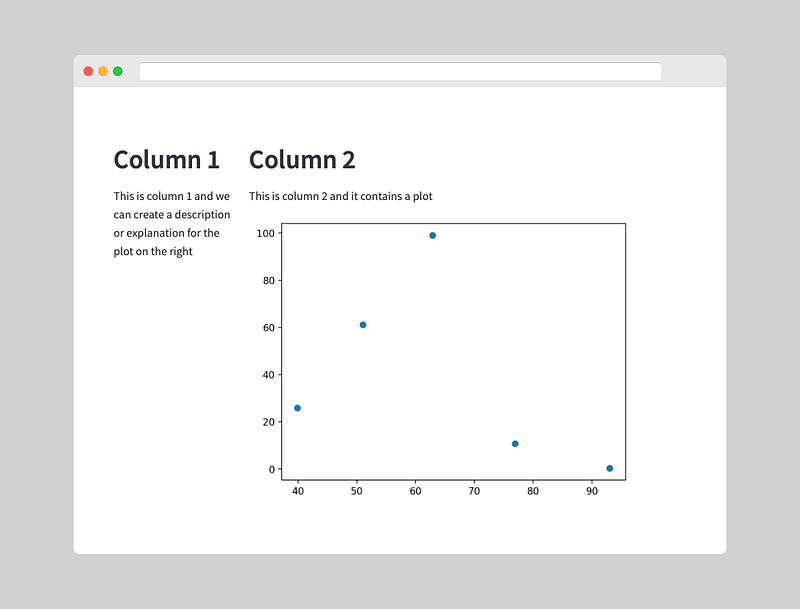
Organise Your App with st.siderbar()
As you start to build bigger apps with Streamlit, you may find that it becomes cluttered and a challenge to find any of the widgets you placed on the page.
Having a sidebar (in a similar way to a conventional webpage) on our Streamlit app allows us to place key input parameters, file uploaders and navigation all within the left-hand side of the Streamlit app.
To create a sidebar for our Streamlit app we simply call upon st.sidebar followed by any of the standard Streamlit functions.
# Sidebar
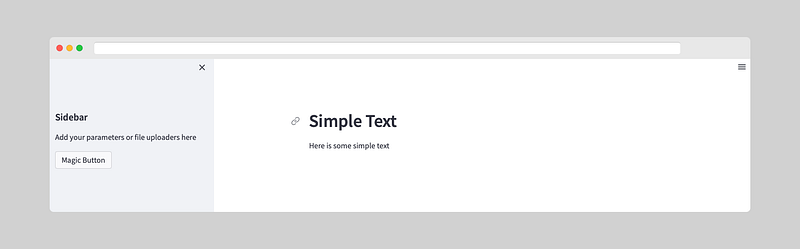
st.sidebar.header('Sidebar')
st.sidebar.write('Add your parameters or file uploaders here')
st.sidebar.button('Magic Button')
# Main Section
st.header('Simple Text')
st.write('Here is some simple text')When this code is run, we can see we have now split our app into two. The left-hand side contains the sidebar and the right-hand side is our main section where we can display charts, data and much more.
If you want to see how to use the sidebar to create a navigation menu, then check out the following article I shared a few months ago:
Upload Files with st.file_uploader()
Streamlit provides functionality for you to allow users of the app to upload files. This is a much better way to load data compared to hard-coding the loading process.
To create a file upload widget, we can call upon st.file_uploader() and pass in a few arguments. In this example, we can use the label argument to provide information about what the user is supposed to upload.
st.header('File Uploader')
uploaded_file = st.file_uploader(label='Please upload your file')
Running the above code will create a basic file uploader widget.
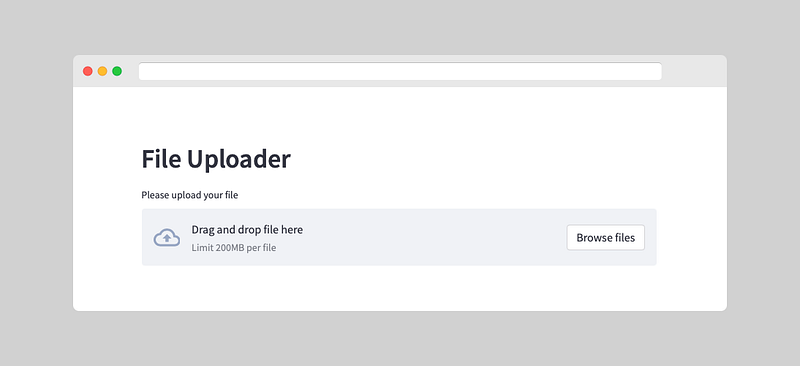
The file uploader in Streamlit is already preformatted, so you don’t need to use any CSS or HTML to enhance its appearance.
Uploading Multiple Files with st.file_uploader()
If we want to allow multiple files to be uploaded we can add in an accept_multiple_files parameter and set it to True:
st.header('File Uploader')
uploaded_file = st.file_uploader(label='Please upload your file',
accept_multiple_files=True)
Restricting File Formations with st.file_uploader()
If we want to restrict the file upload to specific file extensions we can add in the type parameter and pass in a list of file extensions:
st.header('File Uploader')
uploaded_file = st.file_uploader(label='Please upload your file',
type=['.png', '.jpg', '.gif'])
Displaying Key Metrics with st.metric()
When building a dashboard, it is often required to show key metrics or values from your dataset. This allows you to easily communicate with the reader and give them key information at a glance.
You could achieve this with the st.write() function, but to do so would require several lines of code and the use of markdown.
To simplify the displaying of key metrics we can use the st.metric() function.
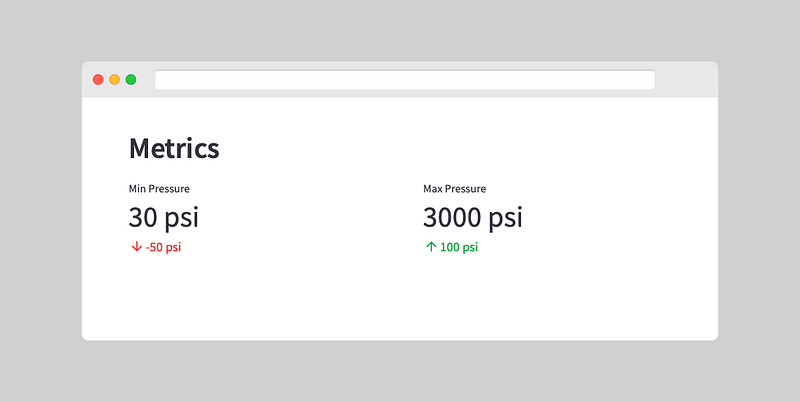
This function takes a label, a value (which can be a variable you have calculated previously) and a delta (a value change).
st.header('Metrics')

col1, col2 = st.columns(2)

with col1:
    st.metric(label="Min Pressure", value="30 psi", delta="-50 psi")

with col2:
    st.metric(label="Max Pressure", value="3000 psi", delta="100 psi")
When we run our app, we will see our key metrics. The deltas for each metric are also displayed and colour coded depending on whether it is a negative change or a positive one.
Summary
Streamlit is a powerful and user-friendly tool that makes it easy to create and access dashboards for data science and machine learning. Creating a Streamlit app is relatively straightforward and with these 5 key functions, you will be able to get started right away.
Thanks for reading. Before you go, you should definitely subscribe to my content and get my articles in your inbox. You can do that here! Alternatively, you can sign up for my newsletter to get additional content straight into your inbox for free.
Secondly, you can get the full Medium experience and support me and thousands of other writers by signing up for a membership. It only costs you $5 a month, and you have full access to all of the amazing Medium articles, as well as the chance to make money with your writing.
If you sign up using my link, you will support me directly with a portion of your fee, and it won’t cost you more. If you do so, thank you so much for your support


