
Getting Started with SAS: Beginner
This quick-start beginner guide is for new SAS users. I have included the SAS Essentials to get you up and running with SAS as quickly as possible.
What is SAS?
SAS is a tool for analyzing statistical data. SAS is an acronym for statistical analytics software. The main purpose of SAS is to retrieve, report and analyze statistical data. Each statement in SAS environment ends with a semicolon otherwise the statement will give an error message. It is a powerful tool for running SQL queries and automating user’s task through macros.
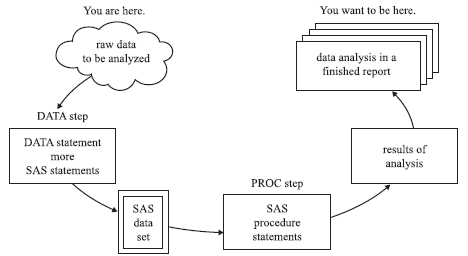
Apart from this SAS offer descriptive visualization through graphs and there are various SAS versions provides reporting of machine learning, data mining, time series etc. SAS supports two types of statements included to run the program. Broadly speaking the statements in a SAS program categorized as : data steps and procedures.
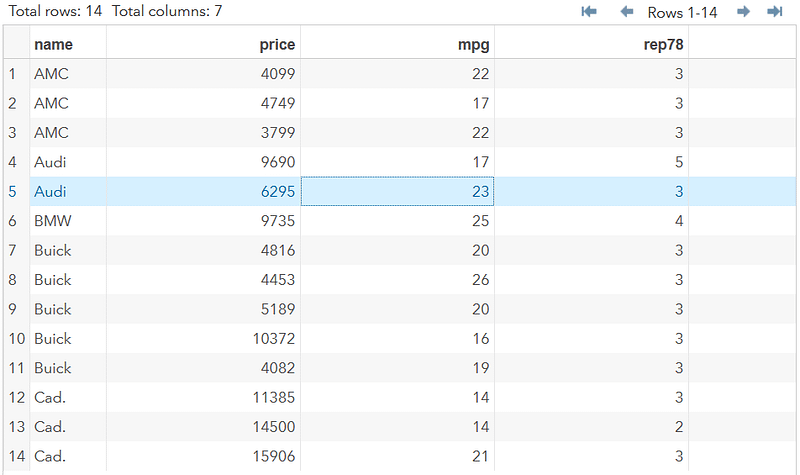
In this article I have tried to explain data analysis using SAS. For the explanation I have created data car with variables price in dollars, length of the car, car’s repair ratings which is a categorical value, foreign value shows whether cars are foreign or domestic, weight and finally mpg (mileage of the car.
Getting Started with SAS Essentials:
Data Step:
The data step consists of all the SAS statements starting with the line data and ending with the line datalines. It describe and modify your data. Within the data step you tell SAS how to read the data and generate or delete variables and observations. The data step transforms your raw data into a SAS dataset. Both cards and datalines statement interchangeably used by SAS. Import of data, reporting variables and descriptive analysis are the part of data step process. There are four statements that are commonly used in the DATA step.
- DATA statement names the dataset
- INPUT statement lists names of the variables
- CARDS statement indicates that data lines immediately follow.
- INFILE statement indicates that data is in a file and the name of the file.
data newdata;
input name $ price mpg rep78 wgt len foreign;
datalines;
AMC 4099 22 3 2930 186 0
AMC 4749 17 3 3350 173 0
AMC 3799 22 3 2640 168 0
Audi 9690 17 5 2830 189 1
Audi 6295 23 3 2070 174 1
BMW 9735 25 4 2650 177 1
Buick 4816 20 3 3250 196 0
Buick 4453 26 3 2230 170 0
Buick 5189 20 3 3280 200 0
Buick 10372 16 3 3880 207 0
Buick 4082 19 3 3400 200 0
Cad. 11385 14 3 4330 221 0
Cad. 14500 14 2 3900 204 0
Cad. 15906 21 3 4290 204 0
; run;Interpretations: In the above code we have created a new dataset newdata having variables name,price,mpg,rep78(repair rating) ,wgt , len and foreign. The dimension of Dataset newdata contain 14 records and 7 variables.
PROC Step:
The PROC steps tell SAS what analysis performed on the data, such as regression, analysis of variance, computation of means, etc. Every PROC statement starts with PROC keyword.
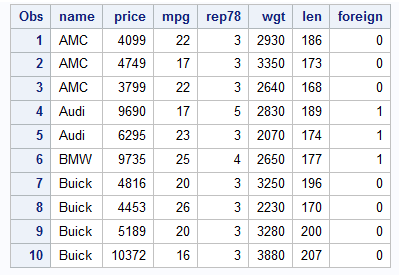
proc print data=newdata(obs=10);
run;
The above statement will run and output the data in following way:
SAS Programming:
1)Import SAS DATA:
PROC import function in SAS is use to import dataset from the excel file. Apart from loading data to SAS environment, SAS also has built-in libraries where dataset stored for user help.
- Temporary Data: The data only last until the current SAS session. This means files have short life also gets deleted when session ends.
- Permanent Data: life long data stored by SAS, it cannot be deleted when session ends.
2)Statistical Descriptive analysis:
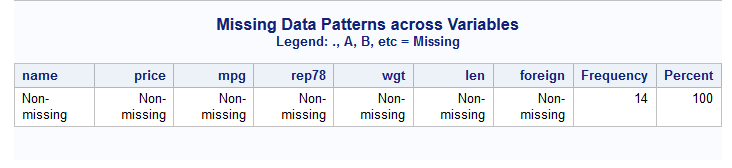
Missing value:
The missing value function represented by a period(.) identifies the number of missing records in the data. In our dataset there is no missing value.
PROC MEAN:
SAS has basic procedure to calculate the average/mean.
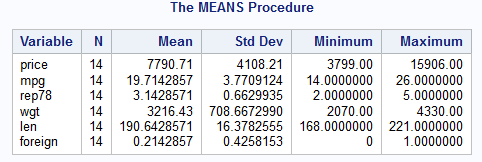
proc means data=newdata;
 run;
Interpretations: average price for the given cars data is $7790.71 where the minimum price is $3799 and the highest is $15906.
PROC FREQ:
SAS has a procedure called PROC FREQ to calculate the frequency distribution of data points in a data set. A frequency distribution is a table showing the frequency of the data points in a data set. Each entry in the table has the frequency or count of the occurrences of values within a particular group or interval, and in this way, distribution of values summarized using tables.
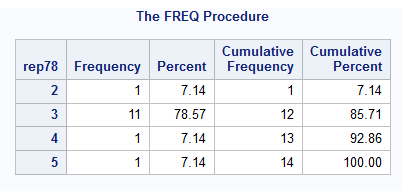
proc freq data=newdata;
tables rep78;
run;
Interpretations: The column Repair rating having rating of 3 frequently occurs in the data, It means that there is 78.5% chances of occurring than rest of the values.
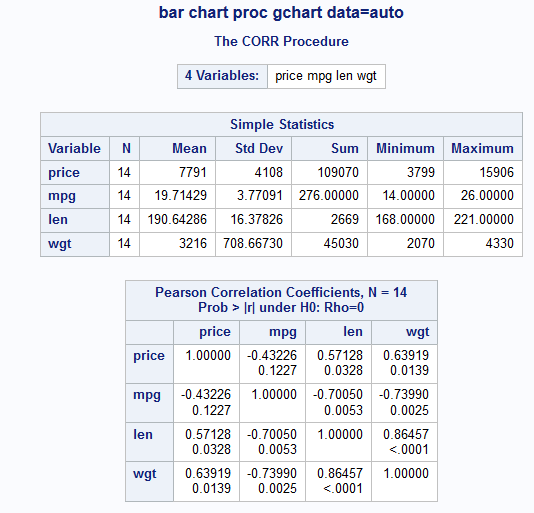
PROC CORR:
The relationship between the two variables x and y can be calculated using CORR function in SAS. Correlation take value between -1 to +1 , a value of 1 shows very strong positive correlation while value of -1 show strong negative correlation.
Interpretations: In the below output length of car and weight shows a positive correlation 0.864 which means if the length of car increases then it’s weight likely to increase that is if we plot a graph between these two variables then we get a straight upward diagonal line where as it can be seen that value of -0.74 indicates negative relationship between len and mpg.
3)Graphs and visualization
SAS tool has powerful graphics function that helps to analyze and report data.
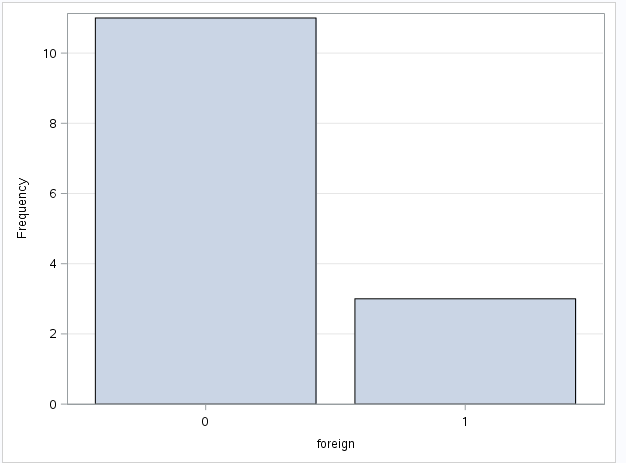
Simple Bar Charts :
Bar chart is one of the most commonly used charts to represent the categorical data well. In this case, cars foreign represented by value 1 is comparatively more than the domestic value 0.
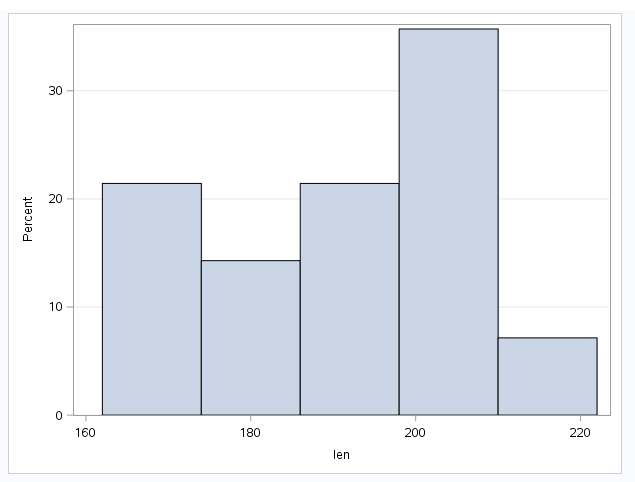
histogram:
Histogram explains the distribution of continuous values. The length values are slightly left skewed which means a long tail towards left which indicates length data is not normally distributed.
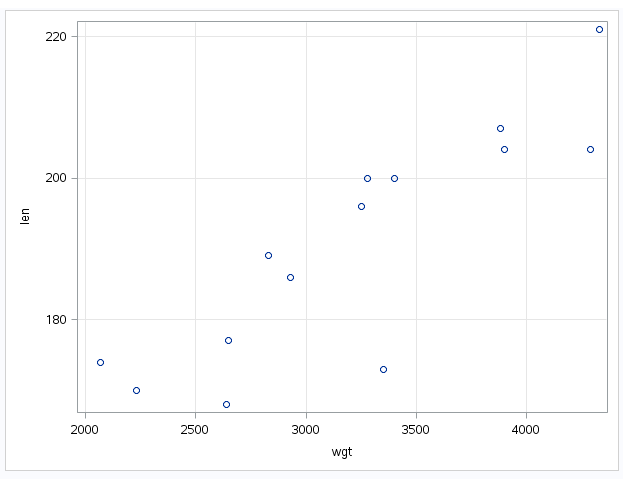
Scatter plot :
Relationship between two variables represented by scatter plot. Graph plotted between two continuous variables. Here, we can see a strong positive trend going upward which shows strong correlation between length and weight.
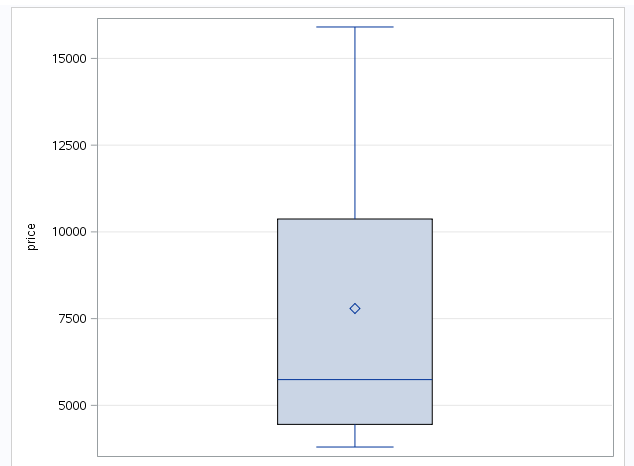
Box plot:
The following graph is a special case of Box plot in which we are displaying continuous variable by a categorical variable. If data set has outliers (extreme values), the box and whiskers chart may not only show the minimum or maximum value. Instead, the ends of the whiskers represents inter-quartile range (1.5*IQR) which is a good attribute to calculate outliers. The variable has a mean of 7790.71 and median is more towards the first quartile. Price variable has few extreme values which further treated before modeling.
Read:
Lesson 1: Getting Started in SAS | STAT 480 — Statistics Online