Getting started with Facebook Prophet
In this article we have provided a worked out example using the Facebook Prophet — https://youtu.be/eJrbKU09h-0
Import libraries
This is Colab (Google cloud / Google drive) and Prophet is pre-installed on it. Colab, or “Colaboratory”, allows you to write and execute Python in your browser, with zero configuration required, access to GPUs free of charge and easy sharing. https://colab.research.google.com/
Prophet is a procedure for forecasting time series data based on an additive model where non-linear trends are fit with yearly, weekly, and daily seasonality, plus holiday effects. It works best with time series that have strong seasonal effects and several seasons of historical data. Prophet is robust to missing data and shifts in the trend, and typically handles outliers well. Prophet is open source software released by Facebook’s Core Data Science team. It is available for download on CRAN and PyPI. https://facebook.github.io/prophet/
from prophet import Prophet from prophet.plot import add_changepoints_to_plot from prophet.diagnostics import cross_validation from prophet.diagnostics import performance_metrics from prophet.plot import plot_cross_validation_metric
Import dataset
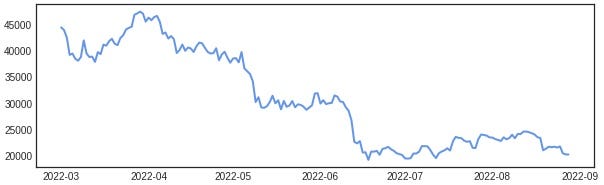
Daily price of Bitcoin is downloaded. The data is from to 2202–03–01 to 2022–08–28.
- You can download the data from https://in.investing.com/crypto/bitcoin/historical-data
- You can also request us to share the csv file used in this analysis
The input to Prophet is always a dataframe with two columns: ds and y.
- The ds (datestamp) column should be of a format expected by Pandas, ideally YYYY-MM-DD for a date or YYYY-MM-DD HH:MM:SS for a timestamp.
- The y column must be numeric, and represents the measurement we wish to forecast.
df = df[[‘Date2’,’Price’]] df.columns = [‘ds’,’y’] df = df.sort_values(‘ds’)
Facebook Prophet
- We fit the model by instantiating a new Prophet object. Any settings to the forecasting procedure are passed into the constructor.
- Then you call its fit method and pass in the historical dataframe.
- Prophet will by default fit weekly and yearly seasonalities, if the time series is more than two cycles long. It will also fit daily seasonality for a sub-daily time series. You can add other seasonalities (monthly, quarterly, hourly) using the add_seasonality method
- library — from prophet import Prophet
- weekly_seasonality=False — because we do not want weekly seasonality in the model
m = Prophet(weekly_seasonality=False) m.fit(df) print(‘\n’,m.component_modes)
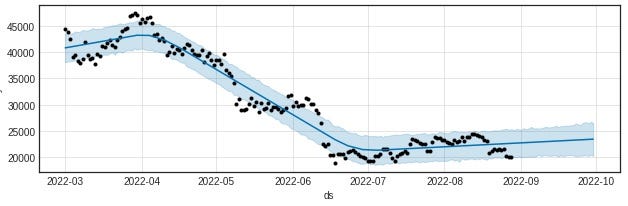
Predictions are then made on a dataframe with a column ds containing the dates for which a prediction is to be made. You can get a suitable dataframe that extends into the future a specified number of days using the helper method Prophet. You can plot the forecast by calling the Prophet.plot method and passing in your forecast dataframe.
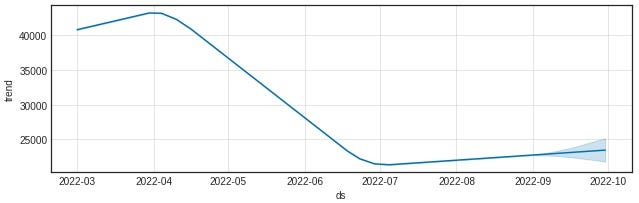
If you want to see the forecast components, you can use the Prophet.plot_components method. By default you’ll see the trend, yearly seasonality, and weekly seasonality of the time series. If you include holidays, you’ll see those here, too. In our model we only have yearly seasonality
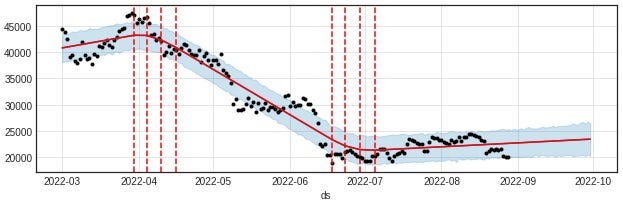
Change point
- Real time series frequently have abrupt changes in their trajectories. By default, Prophet will automatically detect these changepoints and will allow the trend to adapt appropriately.
- Prophet detects changepoints by first specifying a large number of potential changepoints at which the rate is allowed to change. It then puts a sparse prior on the magnitudes of the rate changes (equivalent to L1 regularization) — this essentially means that Prophet will use as few of them as possible.
fig = m.plot(forecast, figsize=(9, 3)) a = add_changepoints_to_plot(fig.gca(), m, forecast)
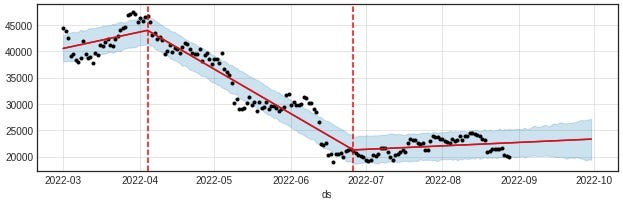
If you wish, rather than using automatic changepoint detection you can manually specify the locations of potential changepoints with the changepoints argument. Slope changes will then be allowed only at these points, with the same sparse regularization as before.
m = Prophet(weekly_seasonality=False, changepoints=[‘2022–04–04’,’2022–06–26']) forecast = m.fit(df).predict(future) fig = m.plot(forecast, figsize=(9, 3)) a = add_changepoints_to_plot(fig.gca(), m, forecast)