

Generating Buy and Sell Signals for SMA, MACD, and Bollinger-Bands with Python💸
If you’ve noticed that there are two major schools of thought with which you can decide upon When to Buy and When to Sell a Stock, one is Technical Analysis📈 the other is Fundamental Analysis.
Technical Analysis looks upon the price action of the underlying stock or a ticker to identify some patterns, whereas, in fundamental Analysis, metrics such as cash flow, revenue, valuation, or industry trends are being looked upon.
With Technical Analysis, one relies upon the numbers, mainly the price and the volume, which is good in the short term though when it comes to the long term, it’s essentially the business that’s gonna grow your money.
In a nutshell, Technical analysis is concerned with forecasting the price of financial securities by analyzing historical market data and evaluating it through statistics, with assumptions such as History tends to repeat itself, Price captures all the information, and there’s always a trend in time-series data.
Technical Analysis forms the basis of:
Algorithmic/Automated/Rule-Based Trading, Indicators such as the RSI(Relative Strength Index), Moving Averages, Oscillators, or the Candle-Stick Chart patterns are used to detect/determine the overbought & oversold levels, the strength of a trend or a trend reversal. There are many indicators that are being used; In this blog post, we will learn how to generate Buy and Sell Signals using some of those.
Module Used:
Pandas TA:
pandas-ta: Pandas Technical Analysis (Pandas TA) is an easy-to-use library that leverages the Pandas package with over 130 Indicators and Utility functions and more than 60 Candlestick Patterns.
To install the library, just open the terminal, activate the conda environment & and do a simple, pip install pandas-ta.
1. Importing the libraries
There are multiple packages like pandas, numpy, and others which we will be using; if you do not have them installed, you can do them with pip
import numpy as np
import pandas as pd
import yfinance as yf
import pandas_datareader.data as web
import pandas_ta as ta
import matplotlib.pyplot as plt
from datetime import date
plt.style.use('fivethirtyeight')
yf.pdr_override()
2. Extracting Data
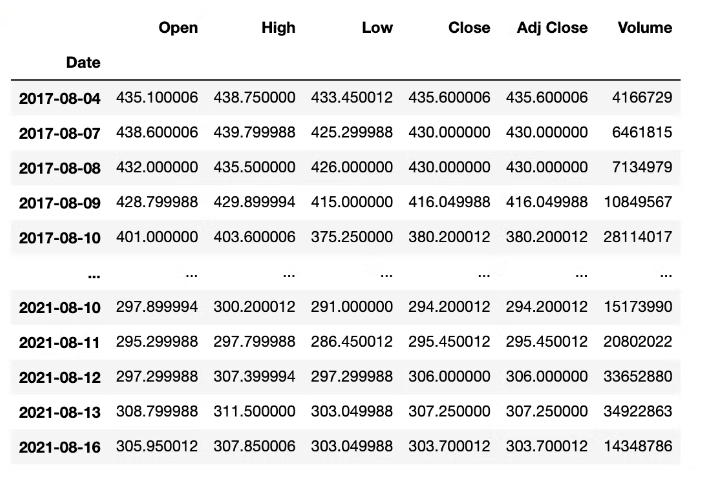
We’ll be Analyzing TATAMOTORS because it is a highly liquid stock that makes the strategies work efficiently, so to extract the data for the same, we’ll use the code written below.
stocksymbols = ['TATAMOTORS.NS']
startdate = date(2017,8,4)
end_date = date.today()
print(end_date)
def getMyPortfolio(stocks = stocksymbols ,start = startdate , end = end_date):
    data = web.get_data_yahoo(stocks , data_source='yahoo' , start = start ,end= end )
    return data
So we’ve created the variables for the start date and the end date to extract the data and defined a function that would take these parameters & return the data.
data = getMyPortfolio(stocksymbols)
data
3. Implementation of the Strategies
SMA: Just to begin with, we’re going to use a very simple indicator first, which is the Simple Moving Averages; the concept for the same is very simple, we take an average of the Close Prices for a certain period to smoothen the trend & depict the general direction of the trend flow.
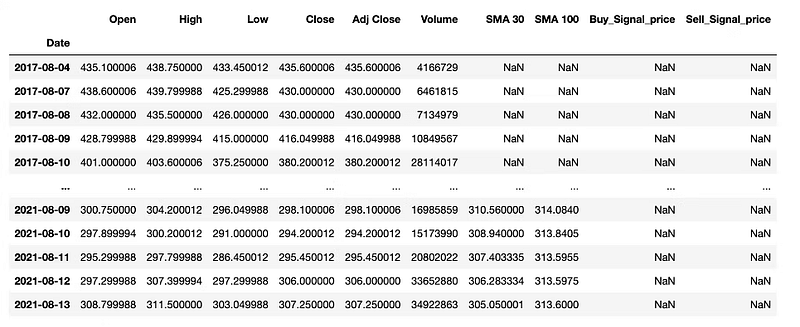
data['SMA 30'] = ta.sma(data['Close'],30)
data['SMA 100'] = ta.sma(data['Close'],100)
#SMA BUY SELL
#Function for buy and sell signal
def buy_sell(data):
    signalBuy = []
    signalSell = []
    position = False

    for i in range(len(data)):
        if data['SMA 30'][i] > data['SMA 100'][i]:
            if position == False :
                signalBuy.append(data['Adj Close'][i])
                signalSell.append(np.nan)
                position = True
            else:
                signalBuy.append(np.nan)
                signalSell.append(np.nan)
        elif data['SMA 30'][i] < data['SMA 100'][i]:
            if position == True:
                signalBuy.append(np.nan)
                signalSell.append(data['Adj Close'][i])
                position = False
            else:
                signalBuy.append(np.nan)
                signalSell.append(np.nan)
        else:
            signalBuy.append(np.nan)
            signalSell.append(np.nan)
    return pd.Series([signalBuy, signalSell])
We have two SMA’s, one for a short period; the other is for a long period. & We’ve written a simple function to Buy when the Short MA is more than the long one & Sell when the Long MA is more than the Short one. So we first created two lists named signalBuy and signalSell; whenever the Buy condition was meeting, we appended the Close Price to the list; else, we appended NaN, then we stored the same lists in our data. We’ve also created a variable named position, which ensures that we take the opposite trade after the previous trade, so if the previous trade was ‘buy’, then the next trade will only be ‘sell’ as the position is set to true.
data['Buy_Signal_price'], data['Sell_Signal_price'] = buy_sell(data)
data
We’ve called the function & Stored the results in our dataframe. Now we’ll plot for the Buy and Sell signals.
Visualization:
fig, ax = plt.subplots(figsize=(14,8))
ax.plot(data['Adj Close'] , label = stocksymbols[0] ,linewidth=0.5, color='blue', alpha = 0.9)
ax.plot(data['SMA 30'], label = 'SMA30', alpha = 0.85)
ax.plot(data['SMA 100'], label = 'SMA100' , alpha = 0.85)
ax.scatter(data.index , data['Buy_Signal_price'] , label = 'Buy' , marker = '^', color = 'green',alpha =1 )
ax.scatter(data.index , data['Sell_Signal_price'] , label = 'Sell' , marker = 'v', color = 'red',alpha =1 )
ax.set_title(stocksymbols[0] + " Price History with buy and sell signals",fontsize=10, backgroundcolor='blue', color='white')
ax.set_xlabel(f'{startdate} - {end_date}' ,fontsize=18)
ax.set_ylabel('Close Price INR (₨)' , fontsize=18)
legend = ax.legend()
ax.grid()
plt.tight_layout()
plt.show()
Output:
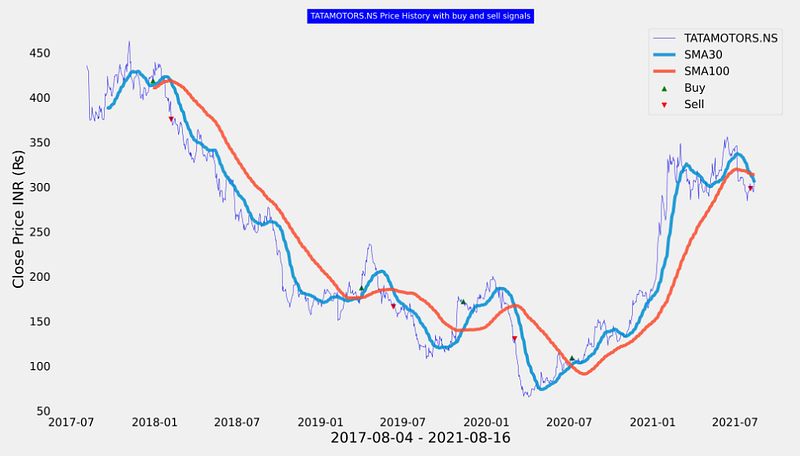
In the above code, we’ve essentially visualized our Buy & Sell levels This shows that moving averages are great at capturing long-term trends with which a decision can be made whether to Buy, Sell or Hold.
MACD: The Moving Average Convergence Divergence indicator (MACD) is calculated using two exponential moving averages (EMA) — short term and long term. An exponential moving average of MACD is used as a signal line to indicate the upward or downward momentum. An exponential moving average is nothing but simply a moving average that gives more weightage to the recent data.
So now we’ll calculate the MACD with pandas-ta; it’ll give us three columns, one is of the difference between the two EMA’s called MACD and one is the EMA of MACD value called as Signal, and the last one is the difference between MACD & Signal called as MACD histogram.
macd = ta.macd(data['Close'])
macd
Now that we’ve got the MACD columns, we’ll merge them with our main dataframe.
data = pd.concat([data, macd], axis=1).reindex(data.index)
data
If the MACD line crosses above the Signal line (moving average of MACD line), we’ll take a long position. In contrast, If the MACD line crosses below the signal line, it is wiser to take a short position on the stock because the trend reversal is anticipated.
Strategy:
def MACD_Strategy(df, risk):
    MACD_Buy=[]
    MACD_Sell=[]
    position=False

    for i in range(0, len(df)):
        if df['MACD_12_26_9'][i] > df['MACDs_12_26_9'][i] :
            MACD_Sell.append(np.nan)
            if position ==False:
                MACD_Buy.append(df['Adj Close'][i])
                position=True
            else:
                MACD_Buy.append(np.nan)
        elif df['MACD_12_26_9'][i] < df['MACDs_12_26_9'][i] :
            MACD_Buy.append(np.nan)
            if position == True:
                MACD_Sell.append(df['Adj Close'][i])
                position=False
            else:
                MACD_Sell.append(np.nan)
        elif position == True and df['Adj Close'][i] < MACD_Buy[-1] * (1 - risk):
            MACD_Sell.append(df["Adj Close"][i])
            MACD_Buy.append(np.nan)
            position = False
        elif position == True and df['Adj Close'][i] < df['Adj Close'][i - 1] * (1 - risk):
            MACD_Sell.append(df["Adj Close"][i])
            MACD_Buy.append(np.nan)
            position = False
        else:
            MACD_Buy.append(np.nan)
            MACD_Sell.append(np.nan)

    data['MACD_Buy_Signal_price'] = MACD_Buy
    data['MACD_Sell_Signal_price'] = MACD_Sell
We’ve also included a Risk factor in our strategy. If the current price goes beyond the acceptable limits or if the current price goes beyond the specified percentage, we’ll sell. In simple terms, we’ve added a STOP LOSS and a Trailing Stop loss to our strategy.
MACD_strategy = MACD_Strategy(data, 0.025)
MACD_strategy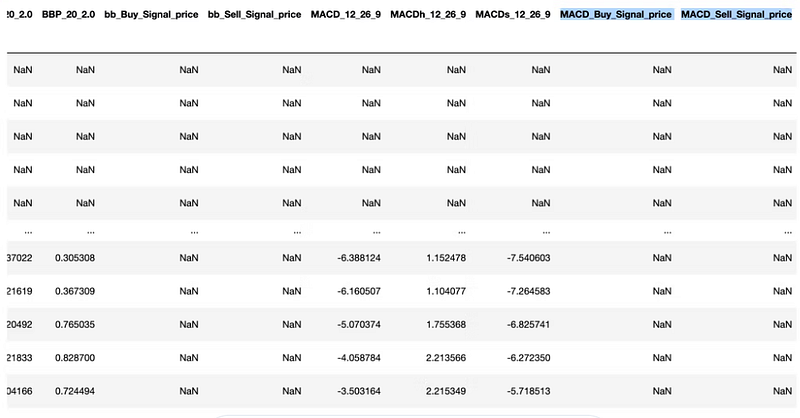
We’ve set the Risk tolerance level to 2.5%, So, for example, if we buy at 100 and the price goes beyond 97.5 (100 * (1–0.025)), we’ll sell. We’ll trail our stop loss, which means that if we buy at 100 and the price goes to 110, our stop loss will be 107.25 (110 * (1–0.025)).
To visualize the MACD histogram we create a simple function to insert a boolean column.
def MACD_color(data):
    MACD_color = []
    for i in range(0, len(data)):
        if data['MACDh_12_26_9'][i] > data['MACDh_12_26_9'][i - 1]:
            MACD_color.append(True)
        else:
            MACD_color.append(False)
    return MACD_color

data['positive'] = MACD_color(data)
data
Visualization:
plt.rcParams.update({'font.size': 10})
fig, ax1 = plt.subplots(figsize=(14,8))
fig.suptitle(stocksymbols[0], fontsize=10, backgroundcolor='blue', color='white')
ax1 = plt.subplot2grid((14, 8), (0, 0), rowspan=8, colspan=14)
ax2 = plt.subplot2grid((14, 12), (10, 0), rowspan=6, colspan=14)
ax1.set_ylabel('Price in ₨')
ax1.plot('Adj Close',data=data, label='Close Price', linewidth=0.5, color='blue')
ax1.scatter(data.index, data['MACD_Buy_Signal_price'], color='green', marker='^', alpha=1)
ax1.scatter(data.index, data['MACD_Sell_Signal_price'], color='red', marker='v', alpha=1)
ax1.legend()
ax1.grid()
ax1.set_xlabel('Date', fontsize=8)

ax2.set_ylabel('MACD', fontsize=8)
ax2.plot('MACD_12_26_9', data=data, label='MACD', linewidth=0.5, color='blue')
ax2.plot('MACDs_12_26_9', data=data, label='signal', linewidth=0.5, color='red')
ax2.bar(data.index,'MACDh_12_26_9', data=data, label='Volume', color=data.positive.map({True: 'g', False: 'r'}),width=1,alpha=0.8)
ax2.axhline(0, color='black', linewidth=0.5, alpha=0.5)
ax2.grid()
plt.show()
BB: Bollinger bands are one of the most used indicators in the world of trading, simply because it is so powerful and yet very simple.
They comprise of three lines,
Upper Bollinger band, Middle Bollinger band, Lower Bollinger band. The upper and lower Bollinger bands are plotted two standard deviations away from the mean average of the Close Price. The two bands comprise more than 80% of the price action, thus making any price above or below the bands highly significant.
Strategy:
def bb_strategy(data):
bbBuy = []
bbSell = []
position = False
bb = ta.bbands(data['Adj Close'], length=20,std=2)
data = pd.concat([data, bb], axis=1).reindex(data.index)
for i in range(len(data)):
if data['Adj Close'][i] < data['BBL_20_2.0'][i]:
if position == False :
bbBuy.append(data['Adj Close'][i])
bbSell.append(np.nan)
position = True
else:
bbBuy.append(np.nan)
bbSell.append(np.nan)
elif data['Adj Close'][i] > data['BBU_20_2.0'][i]:
if position == True:
bbBuy.append(np.nan)
bbSell.append(data['Adj Close'][i])
position = False #To indicate that I actually went there
else:
bbBuy.append(np.nan)
bbSell.append(np.nan)
else :
bbBuy.append(np.nan)
bbSell.append(np.nan)
data['bb_Buy_Signal_price'] = bbBuy
data['bb_Sell_Signal_price'] = bbSell
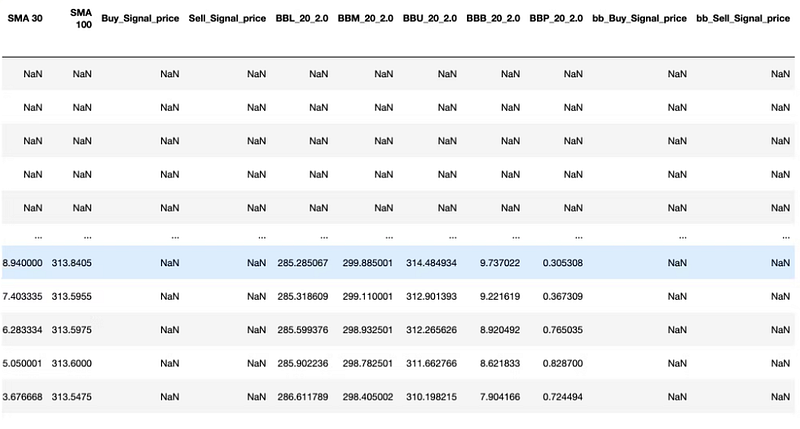
return dataIn this above function, we called out the ‘bbbands’ function of pandas_ta and then contacted the resulting data frame with our original data. We’ve built the strategy logic as Buy when the Close Price touches upon the lower band (BBL_ length_standard-deviation) indicating an oversold scenario and Sell when the Close Price touches upon the upper band (BBU_ length_standard-deviation) indicating an overbought scenario.
Storing the above function:
#storing the function
data = bb_strategy(data)
data
Output:
Visualization:
#plot
fig, ax1 = plt.subplots(figsize=(14,8))
fig.suptitle(stocksymbols[0], fontsize=10, backgroundcolor='blue', color='white')
ax1 = plt.subplot2grid((14, 8), (0, 0), rowspan=8, colspan=14)
ax2 = plt.subplot2grid((14, 12), (10, 0), rowspan=6, colspan=14)
ax1.set_ylabel('Price in ₨')
ax1.plot(data['Adj Close'],label='Close Price', linewidth=0.5, color='blue')
ax1.scatter(data.index, data['bb_Buy_Signal_price'], color='green', marker='^', alpha=1)
ax1.scatter(data.index, data['bb_Sell_Signal_price'], color='red', marker='v', alpha=1)
ax1.legend()
ax1.grid()
ax1.set_xlabel('Date', fontsize=8)

ax2.plot(data['BBM_20_2.0'], label='Middle', color='blue', alpha=0.35) #middle band
ax2.plot(data['BBU_20_2.0'], label='Upper', color='green', alpha=0.35) #Upper band
ax2.plot(data['BBL_20_2.0'], label='Lower', color='red', alpha=0.35) #lower band
ax2.fill_between(data.index, data['BBL_20_2.0'], data['BBU_20_2.0'], alpha=0.1)
ax2.legend(loc='upper left')
ax2.grid()
plt.show()
Output:
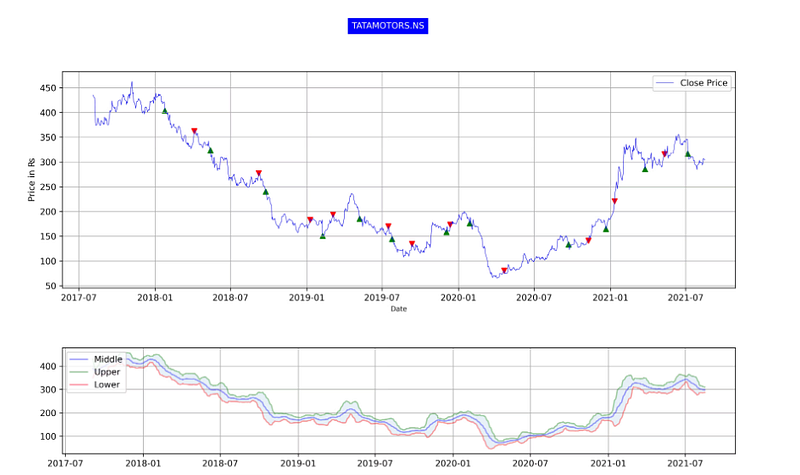
Our Strategy is based on the assumption that any time the closing price goes below or above the Bollinger bands, there are high chances for price reversion, and hence it can be used as a signal but can’t be entirely relied upon as there might be an underlying event driving the stock.
4. Wrapping it up
And with that, it’s a wrap!
The field of Technical Analysis is itself very vast as there are way too many indicators. One must understand the underlying concept/intent behind the construction of these indicators to build a successful trading strategy by combining some of them or build a whole new indicator altogether.
As we’re diving deep into the field of Algorithmic trading with the help of technical indicators 📉, the complexity will itself increase in the future by subtle margins. Nevertheless, I hope you enjoyed this article!


