GAN — How to measure GAN performance?
In GANs, the objective function for the generator and the discriminator usually measures how well they are doing relative to the opponent. For example, we measure how well the generator is fooling the discriminator. It is not a good metric in measuring the image quality or its diversity. As part of the GAN series, we look into the Inception Score and Fréchet Inception Distance on how to compare results from different GAN models.
Inception Score (IS)
IS uses two criteria in measuring the performance of GAN:
- The quality of the generated images, and
- their diversity.
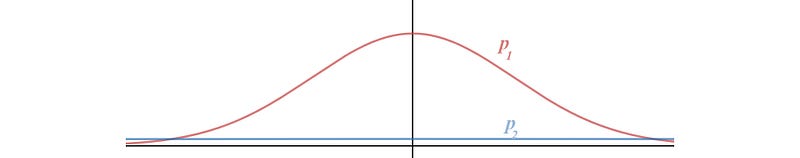
Entropy can be viewed as randomness. If the value of a random variable x is highly predictable, it has low entropy. On the contrary, if it is highly unpredictable, the entropy is high. For example, in the figure below, we have two probability distributions p(x). p2 has a higher entropy than p1 because p2 has a more uniform distribution and therefore, less predictable about what x is.
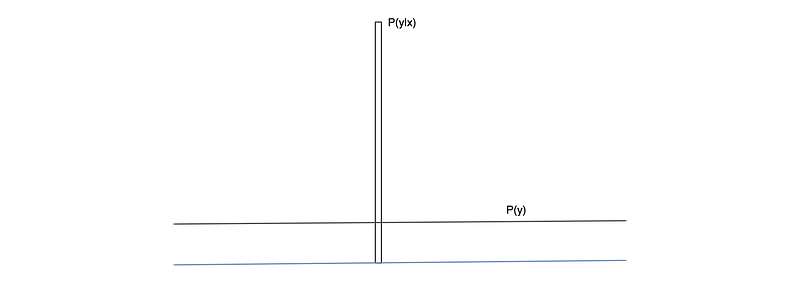
In GAN, we want the conditional probability P(y|x) to be highly predictable (low entropy). i.e. given an image, we should know the object type easily. So we use an Inception network to classify the generated images and predict P(y|x) — where y is the label and x is the generated data. This reflects the quality of the images. Next we need to measure the diversity of images.
P(y) is the marginal probability computed as:

If the generated images are diverse, the data distribution for y should be uniform (high entropy).
The figure below visualizes this concept.
To combine these two criteria, we compute their KL-divergence and use the equation below to compute IS.

One shortcoming for IS is that it can misrepresent the performance if it only generates one image per class. p(y) will still be uniform even though the diversity is low.
Fréchet Inception Distance (FID)
In FID, we use the Inception network to extract features from an intermediate layer. Then we model the data distribution for these features using a multivariate Gaussian distribution with mean µ and covariance Σ. The FID between the real images x and generated images g is computed as:

where Tr sums up all the diagonal elements.
Lower FID values mean better image quality and diversity.
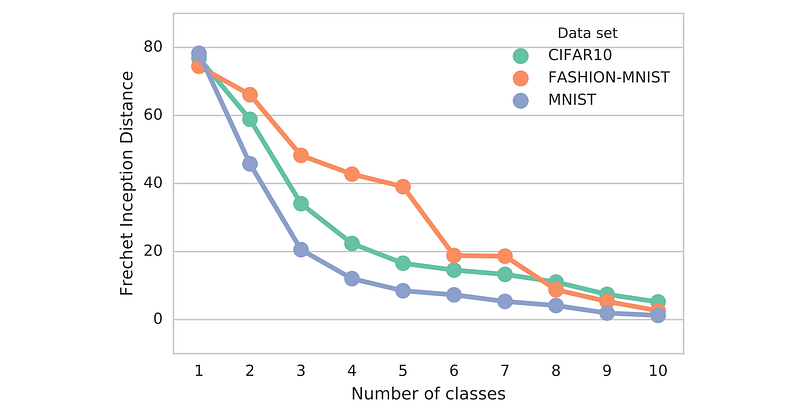
FID is sensitive to mode collapse. As shown below, the distance increases with simulated missing modes.
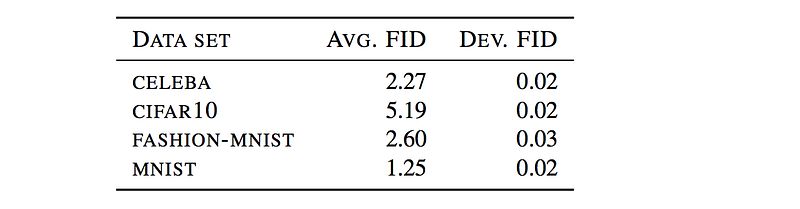
FID is more robust to noise than IS. If the model only generates one image per class, the distance will be high. So FID is a better measurement for image diversity. FID has some rather high bias but low variance. By computing the FID between a training dataset and a testing dataset, we should expect the FID to be zero since both are real images. However, running the test with different batches of training sample shows none zero FID.
Also, both FID and IS are based on the feature extraction (the presence or the absence of features). Will a generator have the same score if the spatial relationship is not maintained?

Precision, Recall and F1 Score
If the generated images look similar to the real images on average, the precision is high. High recall implies the generator can generate any sample found in the training dataset. A F1 score is the harmonic average of precision and recall.
In the Google Brain research paper “Are GANs created equal”, a toy experiment with a dataset of triangles is created to measure the precision and the recall of different GAN models.
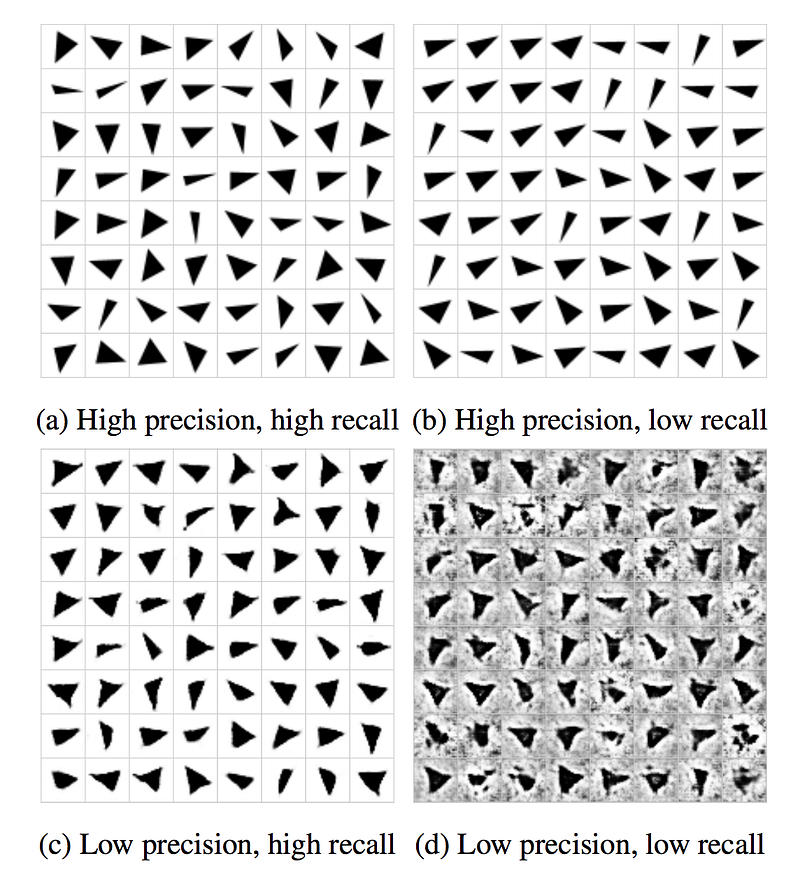
This toy dataset can measure the performance of different GAN model. We can use it to measure the merit of different cost functions. For example, will the new function good at producing high-quality triangle with a good coverage?
Reference
Improved Techniques for Training GANs
Are GANs Created Equal? A Large-Scale Study
GANs Trained by a Two Time-Scale Update Rule Converge to a Local Nash Equilibrium