
Future Backtesting Supertrend RSI Trading Strategy With Python: 22 823$ Profit

Supertrend and RSI are two popular technical indicators used by traders to make profitable trades in the stock market. Supertrend is a trend-following indicator that helps identify the current trend of the market, while the Relative Strength Index (RSI) is a momentum oscillator that measures the strength of the current trend.
In this article, we will explain what Supertrend and RSI are and how to use them together in a trading strategy in Python.
What is RSI?
The Relative Strength Index (RSI) is a momentum oscillator that measures the strength of the current trend. It oscillates between 0 and 100 and is calculated using the average gains and losses over a specific period. The RSI is considered overbought when it’s above 70 and oversold when it’s below 30. Traders use the RSI to identify potential trend reversals or to confirm the strength of the current trend.
What is Supertrend?
Supertrend is a trend-following indicator that helps identify the current trend of the market. It’s based on the average true range (ATR) and can be used to identify the direction of the trend and potential entry and exit points. The Supertrend indicator generates buy signals when the price is above the indicator line and sell signals when the price is below the indicator line.
Using Supertrend and RSI Together in a Trading Strategy
To use Supertrend and RSI together in a trading strategy, we need to define our data frame (df) and the conditions for our strategy. We can define the Supertrend using the following code:
superTrend = pda.supertrend(high=df['high'], low=df['low'],close=df['close'], length=ST_length, multiplier=ST_multiplier)
df['SUPER_TREND'] = (superTrend['SUPERT_'+str(ST_length)+"_"+str(ST_multiplier)] - df['close'])/df['close']
df['SUPER_TREND_DIRECTION'] = superTrend['SUPERTd_'+str(ST_length)+"_"+str(ST_multiplier)]
df['RSI']=ta.momentum.rsi(close=df['close'], window=14,fillna= True)
We can then generate our trading signals based on the RSI and Supertrend. In the following code, we create a list called signals that will contain our trading signals. We loop through our data frame and check the conditions for our strategy. If the RSI is above 49 and the Supertrend direction is positive, we generate a buy signal. If the RSI is below 51 and the Supertrend direction is negative, we generate a sell signal. Otherwise, we generate a hold signal.
signals.append(0)
for i in range(1, len(df)-1):
    if df.iloc[i]['RSI'] > 49 and df.iloc[i]['SUPER_TREND_DIRECTION'] > 0:
        signals.append(1)
    elif df.iloc[i]['RSI'] < 51 and df.iloc[i]['SUPER_TREND_DIRECTION'] < 0:
        signals.append(-1)
    else :
        signals.append(0)
signals.append(0)
df["signal"] = signals
Finally, we can backtest our trading strategy by simulating trades based on our signals. In the following code, we loop through our data frame and simulate trades based on our signals. We keep track of our current investment, invested amount, fees, and profit. We also keep track of our best and worst trades, largest loss, largest gain, and total trades.
Let’s make a Future backtest with ETHUSDT now in 1h timeframe :
Here is an example implementation of the strategy:
df["signal"] = signals
print(signals)
investment = 1000
current_investment = 1000
invested_amount = 0
fees = 0
profit = 0
is_invested = 0
best_trade = -99999999
worst_trade = 99999999
largest_loss = 0
largest_gain = 0
total_trades = 0

for i in range(500, len(df)):
    signal = df.iloc[i]['signal']
    close = df.iloc[i]['close']

    if signal == 1 and is_invested == 0:  # Long signal and no position
        entry_point = close
        quantity = (current_investment / close)
        invested_amount = quantity * close
        is_invested = 1
    elif signal == -1 and is_invested == 0:  # Short signal and no position
        entry_point = close
        quantity = (current_investment / close)
        invested_amount = quantity * close
        is_invested = -1
    elif signal == -1 and is_invested == 1 :  # Close long position for short signal
        profit = quantity * (- entry_point + close)
        current_investment += profit
        invested_amount = 0
        total_trades += 1
        if profit > largest_gain:
            largest_gain = profit
        if profit < largest_loss:
            largest_loss = profit
        if profit > best_trade:
            best_trade = profit
        if profit < worst_trade:
            worst_trade = profit
        entry_point = close
        quantity = (current_investment / close)
        invested_amount = quantity * close
        is_invested = -1
    elif signal == 1 and is_invested == -1:  # Close short position for long signal
        profit = quantity * ( - close + entry_point)
        current_investment += profit
        invested_amount = 0
        total_trades += 1
        if profit > largest_gain:
            largest_gain = profit
        if profit < largest_loss:
            largest_loss = profit
        if profit > best_trade:
            best_trade = profit
        if profit < worst_trade:
            worst_trade = profit
        entry_point = close
        quantity = (current_investment / close)
        invested_amount = quantity * close
        is_invested = 1
    else:
        pass

final_profit = current_investment - investment
print("Final Profit: ", final_profit)
print("Best Trade: ", best_trade)
print("Worst Trade: ", worst_trade)
print("Largest Loss: ", largest_loss)
print("Largest Gain: ", largest_gain)
print("Total Trades: ", total_trades)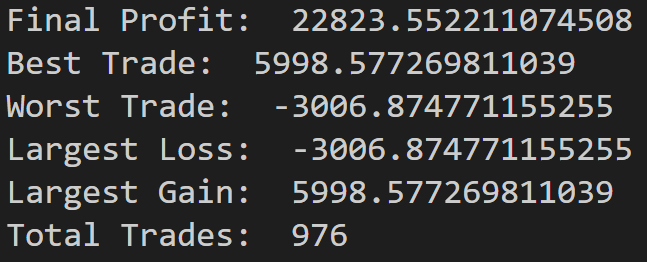
Overall, the Supertrend and RSI strategy in Python is a relatively simple yet effective trading strategy that can be used to generate trading signals and execute trades automatically. However, it’s important to note that past performance is not a guarantee of future success, and trading always carries a certain degree of risk.
As such, it’s important to do your own research, test different strategies, and never invest more than you can afford to lose.


