
Data Science
Fundamentals of series and Data Frame in Pandas with python
Basics of common use parameters in a data frame

Learning pandas is very much important to analyze datasets and make insights from them. It is useful in data series and tables for manipulation and operations on numbers and categorical data. It is a library used in python language for data wrangling.
In our daily work, unknowingly we are generating lots of data in form of numbers, strings, sentences, characters, etc.
In this article, we will discuss the basic terms used in pandas wrangling to understand the working function behind them. This article will cover the following terms as shown below:
1. Series and data Frame
2. Rows and columns
3. Selecting and indexing
4. Axis and Inplace
5. Loc and iloc
6. Conditions on a data frame
7. Missing data in a data frame
8. Dropna and fillna
The explanations of these terms are described below:
Series and Data Frame
In pandas, there are two types of data entry by as a series and as a data frame. The series is sometimes called a vector also because the series is just one-column data. A data frame is a form of a table with rows and columns. A combined adding of two or more series formed a data frame.
The series can be made from index labels, lists, NumPy array, dict, etc.
The example with python is shown below:
#import the libraries for usinf pandas and numpy
import numpy as np
import pandas as pd

#variables of index, list, array and dictionary
labels = ['a','b','c','d']
list = [6,3,9,15]
array = np.array([6,3,9,15])
dict = {'a':6,'b':3,'c':9,'d':15}

#making series in pandas
pd.Series(data=list)
pd.Series(data=list,index=labels)
pd.Series(list,labels)
pd.Series(array)
pd.Series(dict)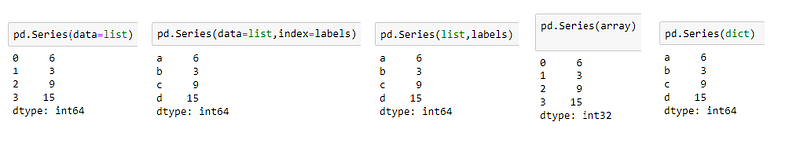
We can use index parameter to give index values. The default index is numerical from “0” indexing.
The data Frame is a collection of Series combined to share the same index positions.
The example with python is shown below in which we are generating random numbers. The split() function is used to split the rows and column names.
from numpy.random import randn
dataframe = pd.DataFrame(randn(5,3),index='0 1 2 3
                              4'.split(),columns='A B C '.split())

print(dataframe)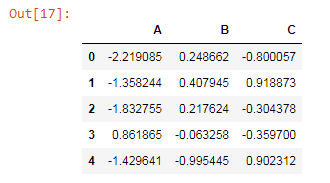
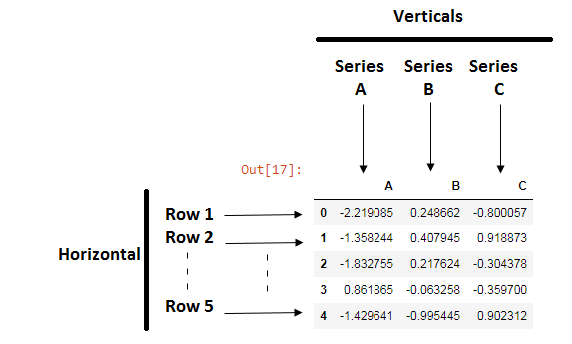
Rows and columns
The rows and columns are the horizontal and vertical position in the data frame table.
Selecting and indexing
The selecting and index in the data frame can be very helpful to access particular columns or rows.
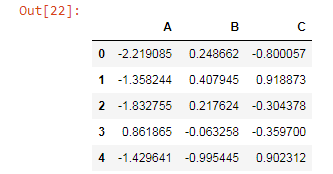
#accessing column in data frame
dataframe['B']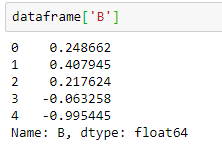
We can pass the list of columns to access the data
dataframe[['A','B']]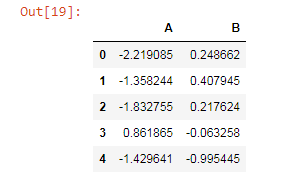
Adding two columns to make a new column.
dataframe['D']=dataframe['A'] + dataframe['B']
print(dataframe)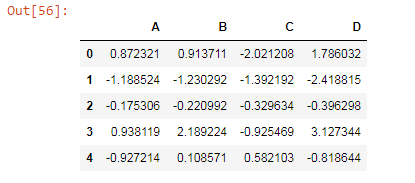
Axis and Inplace
The axis is used to select which way it will work either horizontally or vertically. The value of the axis depends it is for rows or columns, “0” for rows and “1” for columns.
dataframe.drop('D',axis=1)Here the axis=1 means that drop columns and which column we have to drop are mentioned as D.
But just the only use of the drop function with the axis is dropping only for that particular command but not dropping from an original data frame. So, to delete a column from the original data frame we use the inplace parameter.
dataframe.drop('D',axis=1,inplace=True)Loc and iLoc
The main difference between loc and iloc is that loc is used for names of the rows and columns. The iloc is used for accessing the particular rows and columns by integer index.
#selecting row 3
dataframe.loc['3']
dataframe.iloc[1]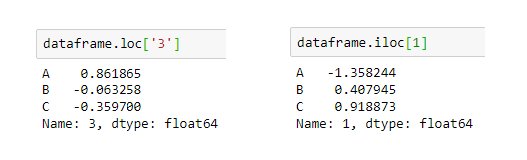
We can also access the particular value from a particular row and column.
dataframe.loc['1','C']

#output:
0.9188734700068232
Conditions on a data frame
The conditions on the data frame are also importing to know insights and analysis. The condition given below says that the values above “0.5” show true and else show False.
dataframe>0.5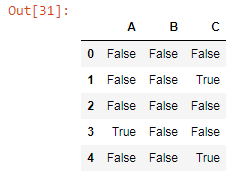
Missing data in a data frame
The missing data in the data set is common. It is a common practice to deal with missing values. The missing values can come from human mistakes, extracting data from a site. Let’s create a missing value data.
dataframe = pd.DataFrame({'English':[1,np.nan,3,4,np.nan,7,2,np.nan],
                  'Math':[5,np.nan,6,5,7,2,np.nan,5],
                  'Hindi':[5,3,6,5,7,2,8,5],
                  'Science':[1,2,3,np.nan,5,np.nan,7,8]})

print(dataframe)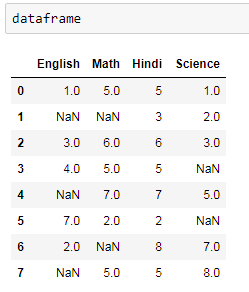
To deal with missing values we use dropna and fillna functions.
Dropna and fillna
The dropna function will drop the missing values and keep the rows in which no missing values are there. But with this, we can lose our information that we make from the data. Less data means less information. So, we also use the fillna method in which the missing values are filled by values that we provide, it can be zero or other values.
dataframe.dropna()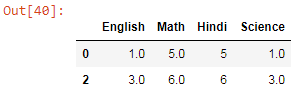
#to delete the columns that have missing values use the "1" value in the axis
dataframe.dropna(axis=1)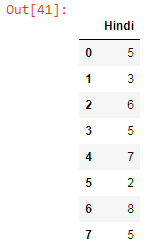
The missing values are filled with zeroes.
dataframe.fillna(value=0)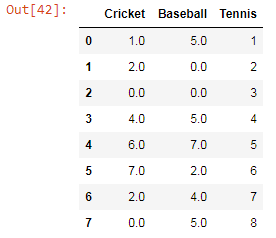
Conclusion:
The basic of pandas is a need to learn data science and machine learning. These are the basic things we can use in our daily practice of coding and algorithm.
I hope you like the article. Reach me on my LinkedIn and twitter.
Recommended Articles
2. Python Data Structures Data-types and Objects


