
Fluentd + Elasticsearch + Kibana, your on-premise logging platform
TL;DR: How to set up an open source logging platform on Kubernetes

Motivation
Logs are mandatory.
We need a way to record and monitor our application's status in real production-grade applications.
In another post, I explored how you can use an OpenTelemetry-based stack to have traces of the requests which pass through our application.
But, what happens if we need to analyze errors or warnings generated from our system?
In the past, the old school way was to connect with the remote server via SSH (or even telnet) and check for the access.log or error.log generated by Apache, Nginx, …
Nowadays we have a lot of solutions for logging capabilities. In the commercial/cloud stack we found AWS CloudWatch or Azure Monitor.
We have open source alternatives too: Sentry, ELK, …
Sentry is awesome… but it’s so heavy to run it for your “small” cluster.
But there is an open-source alternative very interesting: fluentd.
Indeed, fluentd is very used in the Kubernetes world.
I usually use CloudWatch day by day. I would like to achieve a similar experience on my Kubernetes cluster.
After an evaluation of several options, finally I have one…
The players
- Fluentd it’s a logging collector written in Ruby. It supports filtering, parsing, several output options using plug-ins, etc. I will use the plugin
fluent-plugin-elasticsearchto write and index the logs in Elastic. - ElasticSearch (ES) is very used to store and index JSON documents. Nothing new to tell about it, it’s well known.
- Kibana is a great tool for data discovery, visualization, metrics, … ElasticSearch and Kibana are two parts of the trident ELK (Elastic, Logstash and Kibana). We use it as UI to show and classify our logs.
The plan
Fluentd is normally deployed on Kubernetes as DaemonSet. As you probably know, a DaemonSet means that a replica is running on each node of the cluster.
That sounds great for a production-grade deployment but it’s so expensive in resource terms for my goals.
I will use the Deployment resource to deploy it.
Also, fluent client-server communication is performed using a conventional TCP socket communication (using msgpack format).
For my goals, I need to have an HTTP alternative that I can use in services out of my cluster through an HTTPS ingress.
In the case of ES, I don’t need a distributed deployment, so I will deploy it as single node mode.
Let’s start with ES and Kibana
There are a lot of tutorials and how-tos on the Internet about how to deploy ELK on Kubernetes, Docker, …, so I don’t go deeper with details.
ElasticSearch
This is the multi-YAML file for persistent volume claim, deployment and servic e for ElasticSearch.
Just to highlight here that I use NFS subdir provider (yeah, I know, it’s a single point of failure, but it’s for educational purposes). Apart from this, I declare two ports, the most used is 9200 for REST API access.
We apply it
$ kubectl apply -f elastic.yamlKibana
For Kibana I use the following multi YAML declaration for a service, deployment and ingress resources.
Two important things here to underline:
- Deployment: we indicate as environment variable ES service hosts:
elastic-svc:9200 - Ingress: we’ll use
kibana.example.comas the host and a simple basic auth (user/password) to access it. If you want to know how to do that, this official Nginx ingress page explains the process very well.
Apply it!
$ kubectl apply -f kibana.yamlFluentd, the interesting part
The fluentd deployment is not so pretty straightforward but it’s not complicated at all.
As I commented before, to store the logs in ES we need to use a plug-in. There is no official fluentd image with the plugin installed, so I created a public image with the plugin installed.
Its dockerfile is very very simple.
I pushed the image as roblesjm/fluentd-elastic:v1.15-debian-1 in Docker Hub.
Fluentd uses a configuration file fluent.conf to set up the service: inputs, filter, stores, outputs, …
I’ve created a ConfigMap to store the configuration file. Using a ConfigMap volume we can inject the configuration file.
Below the configuration file.
As you can see, we define two inputs: one using the TCP native way under the port 24224, and another using the HTTP handler with the port 9880.
For any log stream under the tag “app.**”, we specify its store in our ES instance.
We create this configmap with the following kubectl statement
$ kubectl create configmap --from-file=fluent.conf=fluent.conf fluent-configWe are almost done!
This is the YAML for deployment, service and ingress.
The only especially thing here is that the Kibana case, we use basic http auth to protect the service.
We apply the last YAML!
$ kubectl apply -f fluentd.yamlTest it!
If everything went well, we are ready to test it our new logging infrastructure.
This is not an egg-chicken problem, so we start creating a log entry with curl.
$ curl -X POST -d 'json={"message": "Houston, we have a problem"}' -u user:a_password https://fluent.example.com/app.infoWe must receive an empty body with a 200 status code. If not, something went wrong. Try to review your set up.
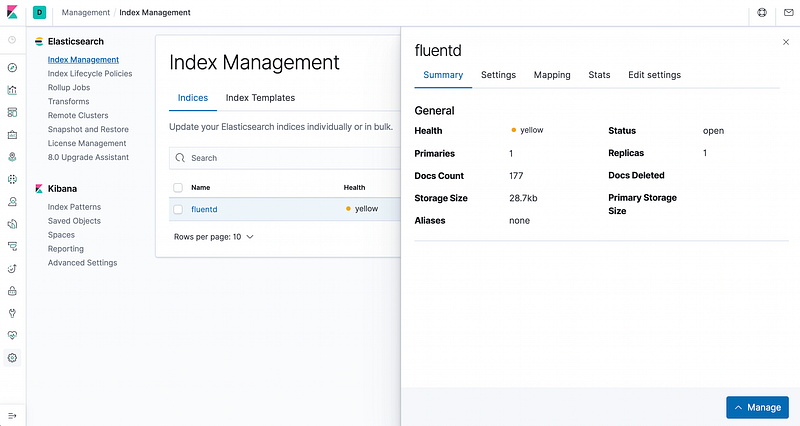
If you open your Kibana UI, you need to create an index first.
Create a new index for the “fluent”. Just follow the wizard.
After that, you must have an index similar to the following one.
The moment of truth, go to “Discover” and you must see something like this
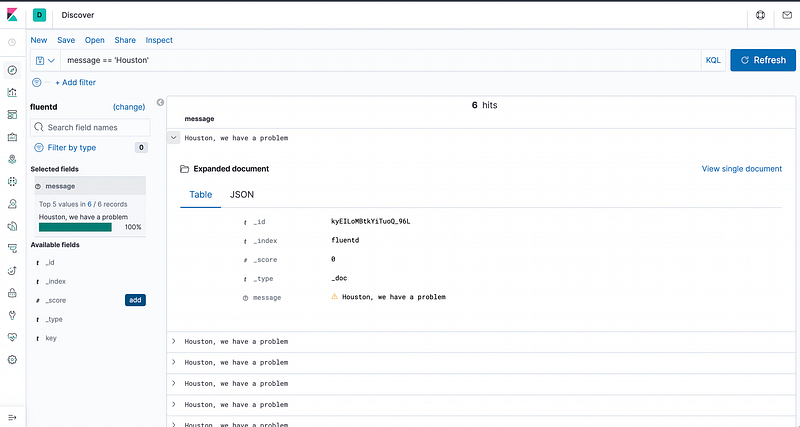
Brilliant! Now we can log any kind of message in our own open source logging platform! You won’t miss any important log entry anymore!